
Newcastle upon Tyne North Boundary Change Map
Compare the former Newcastle upon Tyne North boundary with Newcastle upon Tyne North from July 2024. Buy a vector comparison map for £20, prepared and sent by email, or order a printed map.
Loading the boundary comparison…
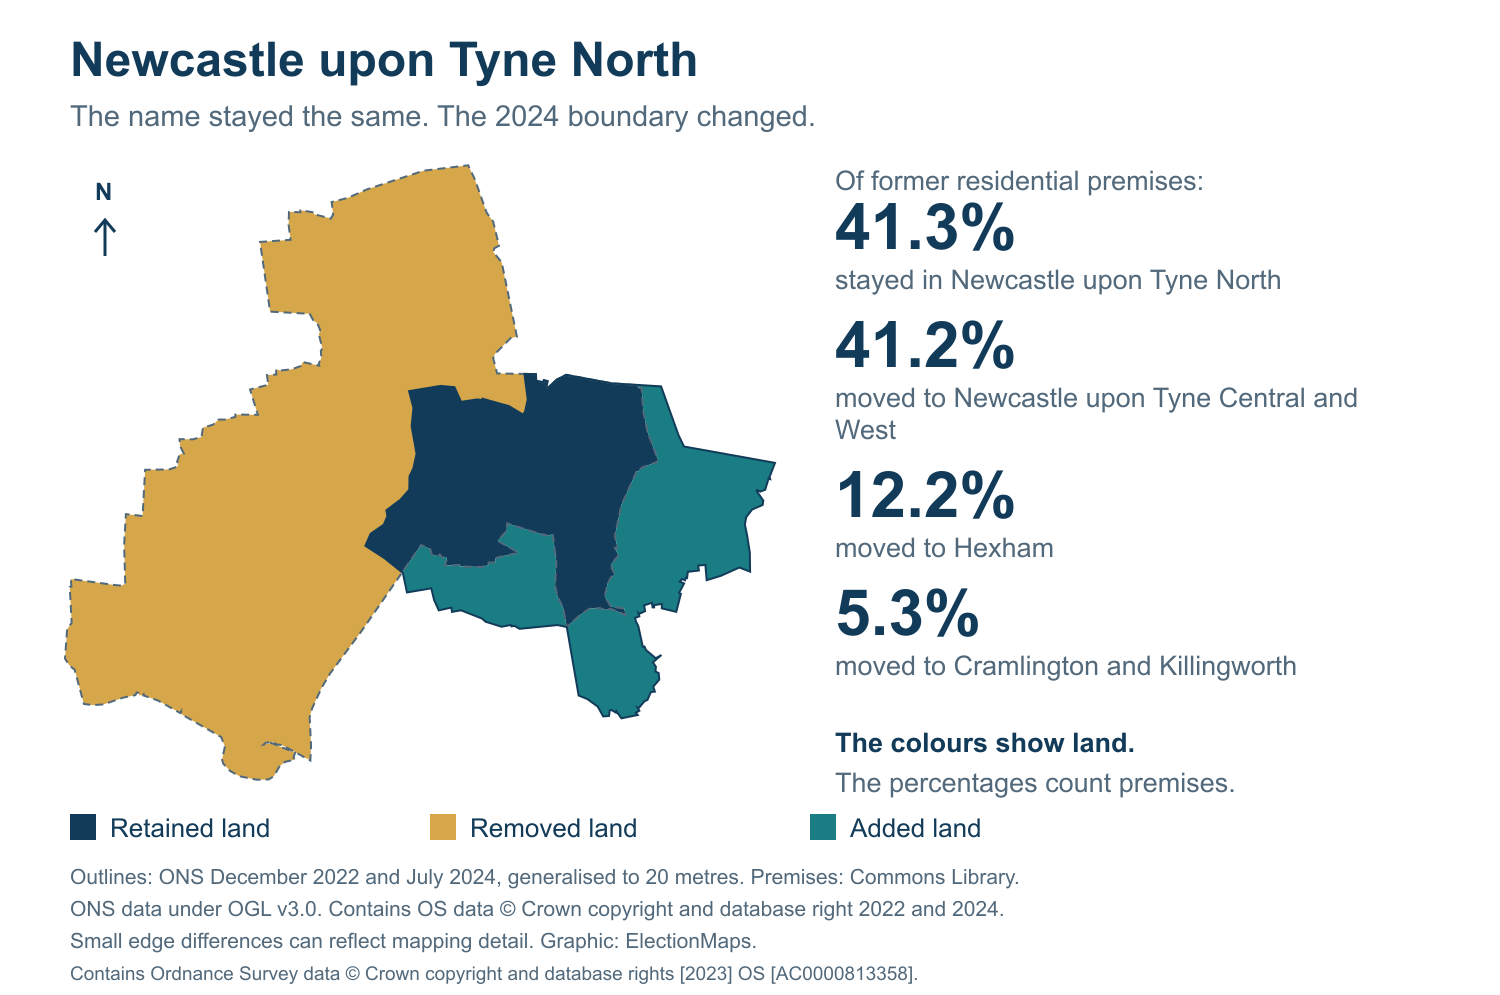
Dashed line: former Newcastle upon Tyne North. Solid line: Newcastle upon Tyne North from 4 July 2024.
Buy this Boundary Map
Vector map files cost £20.00 including VAT. Prints start at £41.00 including VAT and UK delivery.
2019 and 2024 boundary comparison
What changed in 2024?
The former constituency was split between successor constituencies. The map compares the old area with its closest successor, Newcastle upon Tyne North.
| Former constituency | Newcastle upon Tyne North (E14000833) |
| Closest successor | Newcastle upon Tyne North (E14001379) |
| New boundaries in use | 4 July 2024 |
| Old premises retained in this successor | 41.3% |
58.7% of the old constituency’s residential premises moved to other constituencies.
About the comparison map
The colours show land retained, removed and added when this former constituency is compared with its closest successor.
The tables show every linked constituency. Their percentages measure residential premises, not votes, electors or land area.
The preview uses 20-metre generalised boundaries. Small differences along an edge can reflect mapping detail.
View sources and datesWhere did the old area go?
Share of residential premises in the former Newcastle upon Tyne North constituency.
| Constituency from July 2024 | Share | Map |
|---|---|---|
| Newcastle upon Tyne North (closest successor) | 41.3% | View map |
| Newcastle upon Tyne Central and West | 41.2% | View map |
| Hexham | 12.2% | View map |
| Cramlington and Killingworth | 5.3% | View map |
Rounded values may not add up to exactly 100%.
Sources and dates
Comparison figures: House of Commons Library, workbook dated 2023-07-13. Constituency changes took effect at the 2024 general election. Ward memberships use 2023 boundaries.
Map outlines: ONS December 2022 (E14000833) and July 2024 (E14001379), 20-metre generalised boundaries. The map differences and premises figures are separate calculations. Boundary sources and method.
Source: Office for National Statistics licensed under the Open Government Licence v3.0. Contains OS data © Crown copyright and database right 2022 and 2024.
Browse all comparisons · View the current constituency map · Contact us about another map