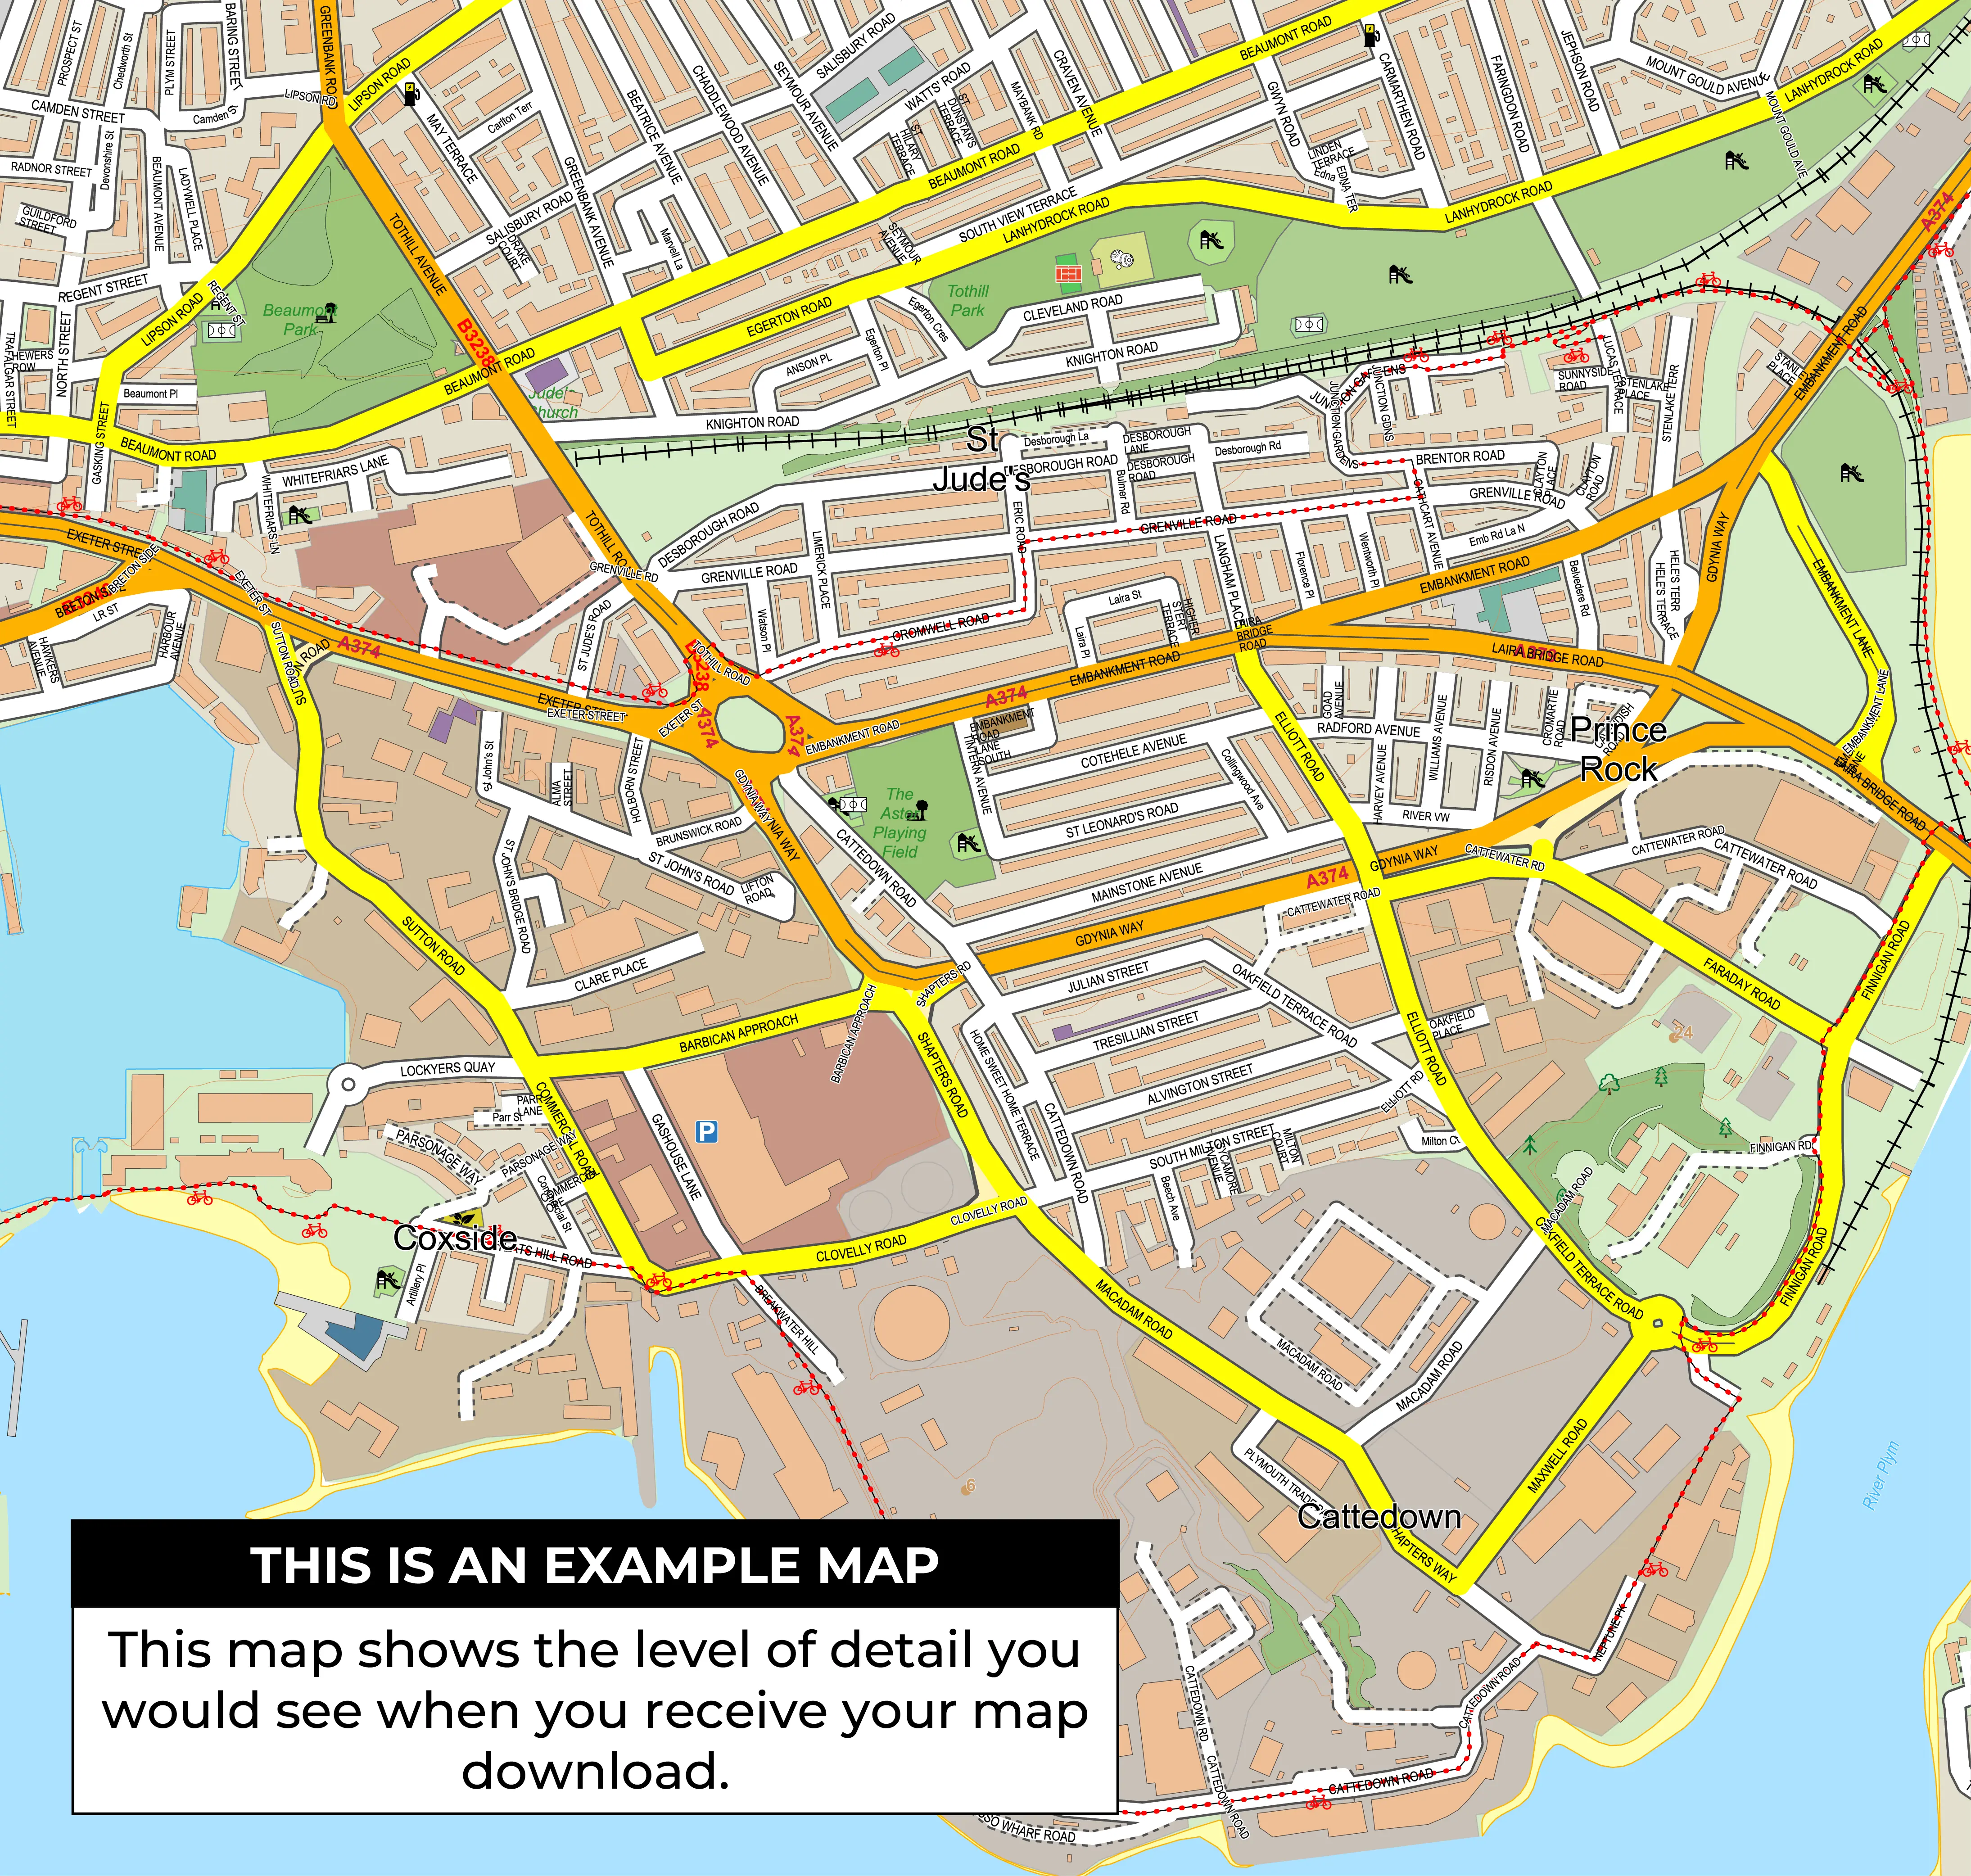
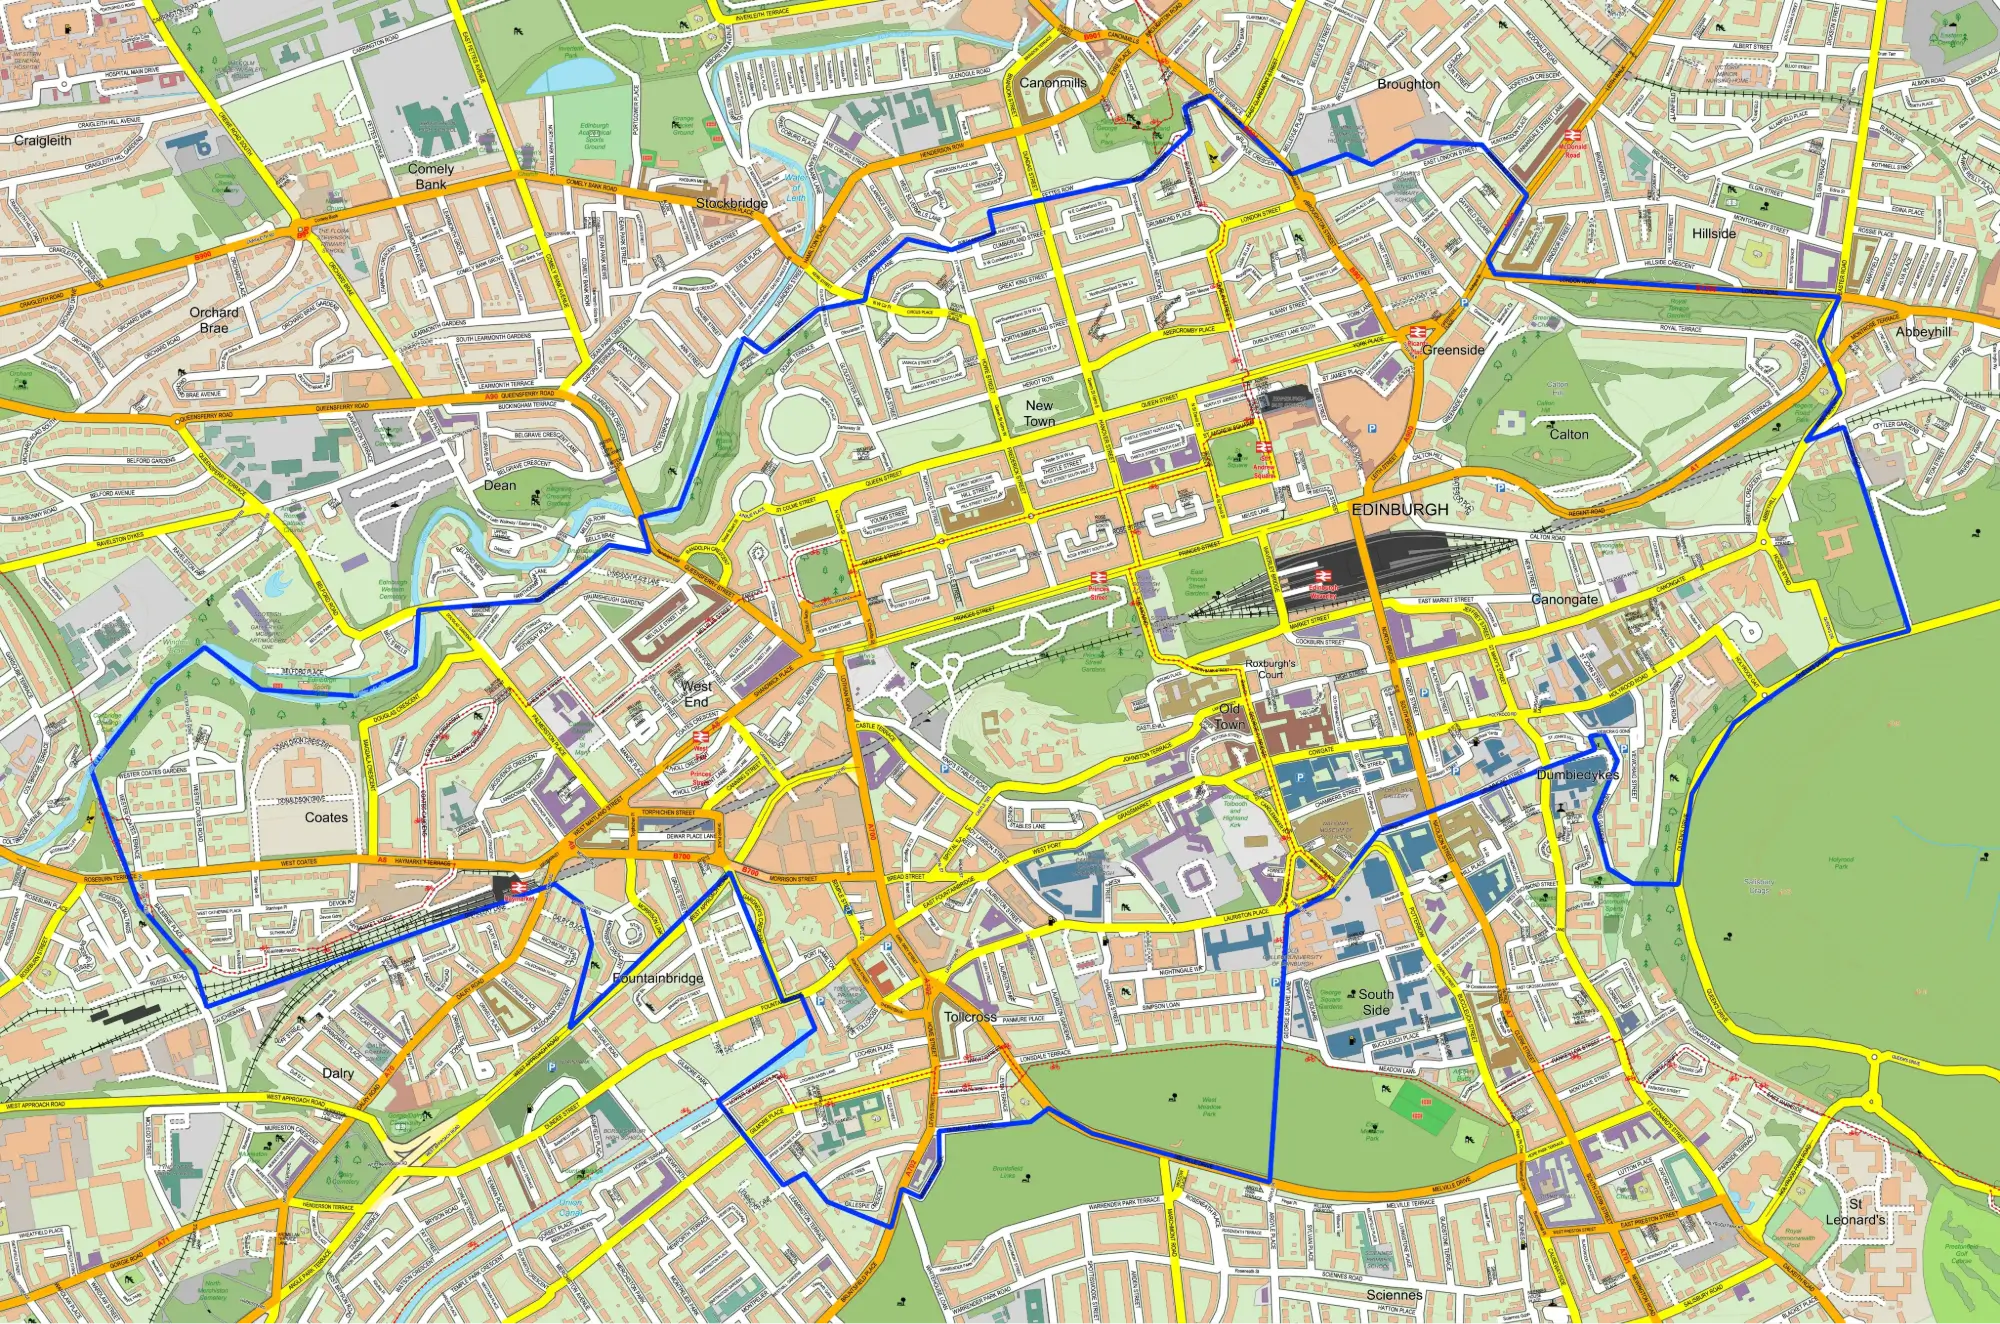
Kew Ward Map
View the Kew ward boundary in Richmond upon Thames. Check constituency links and election results. Buy a digital map for £15 including VAT, or order a print.
Download or Order this Map
Digital map files cost £15.00 including VAT. Printed maps start at £41.00 including VAT and UK delivery.
Request a Custom Map
Full UK Ward Map
All UK ward boundaries on one map, as a digital download or print.
Download £50 including VAT
Prints from £41.00 including VAT and UK delivery.
Explore more London wards and local election results, or see the London constituency map.
Kew Ward Facts
Kew is a ward in Richmond upon Thames, London. The official ward code is E05013782, which is used here to connect the boundary record with constituency links and local election results.
| Ward Name | Kew |
| Ward Code | E05013782 |
| Council Area | Richmond upon Thames |
| County or Unitary Authority | Richmond upon Thames |
| Region | London |
| Country | England |
| Westminster Constituency | Richmond Park |
| Split Ward Status | No |
Create a Custom Map of Kew
A custom map of Kew can be built around the ward boundary, nearby places, council area and parliamentary constituency, making it suitable for campaign planning, local reporting and printed reference maps.
Kew Elected Candidates
The latest matched ward election result for Kew is from 2022. Bridges-Westcott A., Craigie I., Vollum C. were recorded as elected, representing Liberal Democrats.
Bridges-Westcott A.
Liberal Democrats
Bridges-Westcott A. was elected as councillor for Kew with 2544 votes. Bridges-Westcott A. was elected as an incumbent in this election.
Craigie I.
Liberal Democrats
Craigie I. was elected as councillor for Kew with 2443 votes. Craigie I. was elected as an incumbent in this election.
Vollum C.
Liberal Democrats
Vollum C. was elected as councillor for Kew with 2386 votes.
All Candidates Running in Kew
The candidate table shows the full 2022 ward contest for Kew, including vote totals, calculated vote share, incumbent status and whether each candidate was elected. The table includes 10 candidates from 4 parties or groupings.
| Name | Party | Votes | Vote Share | Gender | Incumbent | Result |
|---|---|---|---|---|---|---|
| Bridges-Westcott A. | Liberal Democrats | 2544 | 21.32% | Female | Yes | Elected |
| Craigie I. | Liberal Democrats | 2443 | 20.48% | Male | Yes | Elected |
| Vollum C. | Liberal Democrats | 2386 | 20% | Female | No | Elected |
| Fearon S. | Conservative | 1170 | 9.81% | Female | No | Not Elected |
| Metcalfe R. | Conservative | 1112 | 9.32% | Male | No | Not Elected |
| Ennis S. | Conservative | 1105 | 9.26% | Male | No | Not Elected |
| Hampson N. | Labour | 328 | 2.75% | Male | No | Not Elected |
| White M. | Labour | 305 | 2.56% | Female | No | Not Elected |
| Reyes E. | Womens Equality Party | 275 | 2.31% | Female | No | Not Elected |
| Marder B. | Labour | 262 | 2.2% | Male | No | Not Elected |
Kew Electorate Figures
Recorded figures for Kew in 2022. Electorate: 8,627. Ballots: Not available. Valid-vote turnout: 47.6%.
Electorate
8,627Ballots
Not availableTurnout
47.6%Invalid Votes
Not availableElection Data Available
Election data is available for Kew in 2022. Historical rows are matched by ward code, so some years may be absent where boundaries or codes changed.
Kew Election History
E05013782 has 1 matched election result rows in this dataset. The history table compares winners, seats, turnout, electorate and party vote totals for Kew across the available years.
| Year | Winning candidates | Seats | Turnout | Electorate | Party votes |
|---|---|---|---|---|---|
| 2022 | Bridges-Westcott A., Craigie I., Vollum C. | 3 | 47.6% | 8,627 | 4,317 |
Party Vote Trend
This chart tracks how the recorded party vote totals for Kew have changed across 2022.
Turnout Trend
This chart shows the turnout trend for Kew, using the available ward-level election rows matched to E05013782.
2022 Party Performance
Liberal Democrats recorded the highest party vote total in Kew in 2022, with 2,544 votes. The figures below compare each party against the previous matched election year where available.
Liberal Democrats
2,544No previous resultConservative
1,170No previous resultLabour
328No previous resultOther
275No previous resultGreen
0No previous resultReform UK
0No previous resultIndependent
0No previous resultPrevious Winners
These previous winner rows show how representation in Kew has changed across the historical election records currently linked to this ward code.
What council is Kew in?
Kew is in the Richmond upon Thames council area.
Which Westminster constituency is Kew in?
Kew is in the Richmond Park Westminster constituency.
What is the ward code for Kew?
The official ward code for Kew is E05013782.
Who won the latest election in Kew?
Bridges-Westcott A., Craigie I., Vollum C. were recorded as elected councillors for Kew in the latest available election result.
Who stood as candidates in Kew?
Bridges-Westcott A., Craigie I., Vollum C., Fearon S., Metcalfe R., Ennis S., Hampson N., White M., Reyes E., Marder B. stood as candidates in the latest available election result for Kew.
What was turnout in Kew?
The latest available election result for Kew records these figures. Ballots: Not available. Valid-vote turnout: 47.6%.
How did each party perform in Kew?
Liberal Democrats recorded the highest party vote total in Kew in 2022, with 2,544 votes. The figures below compare each party against the previous matched election year where available.
How many people were registered to vote in Kew?
8,627 people were registered to vote in Kew in the latest available election result.
How many invalid votes were there in Kew?
Invalid vote data is not available for the latest recorded election in Kew.