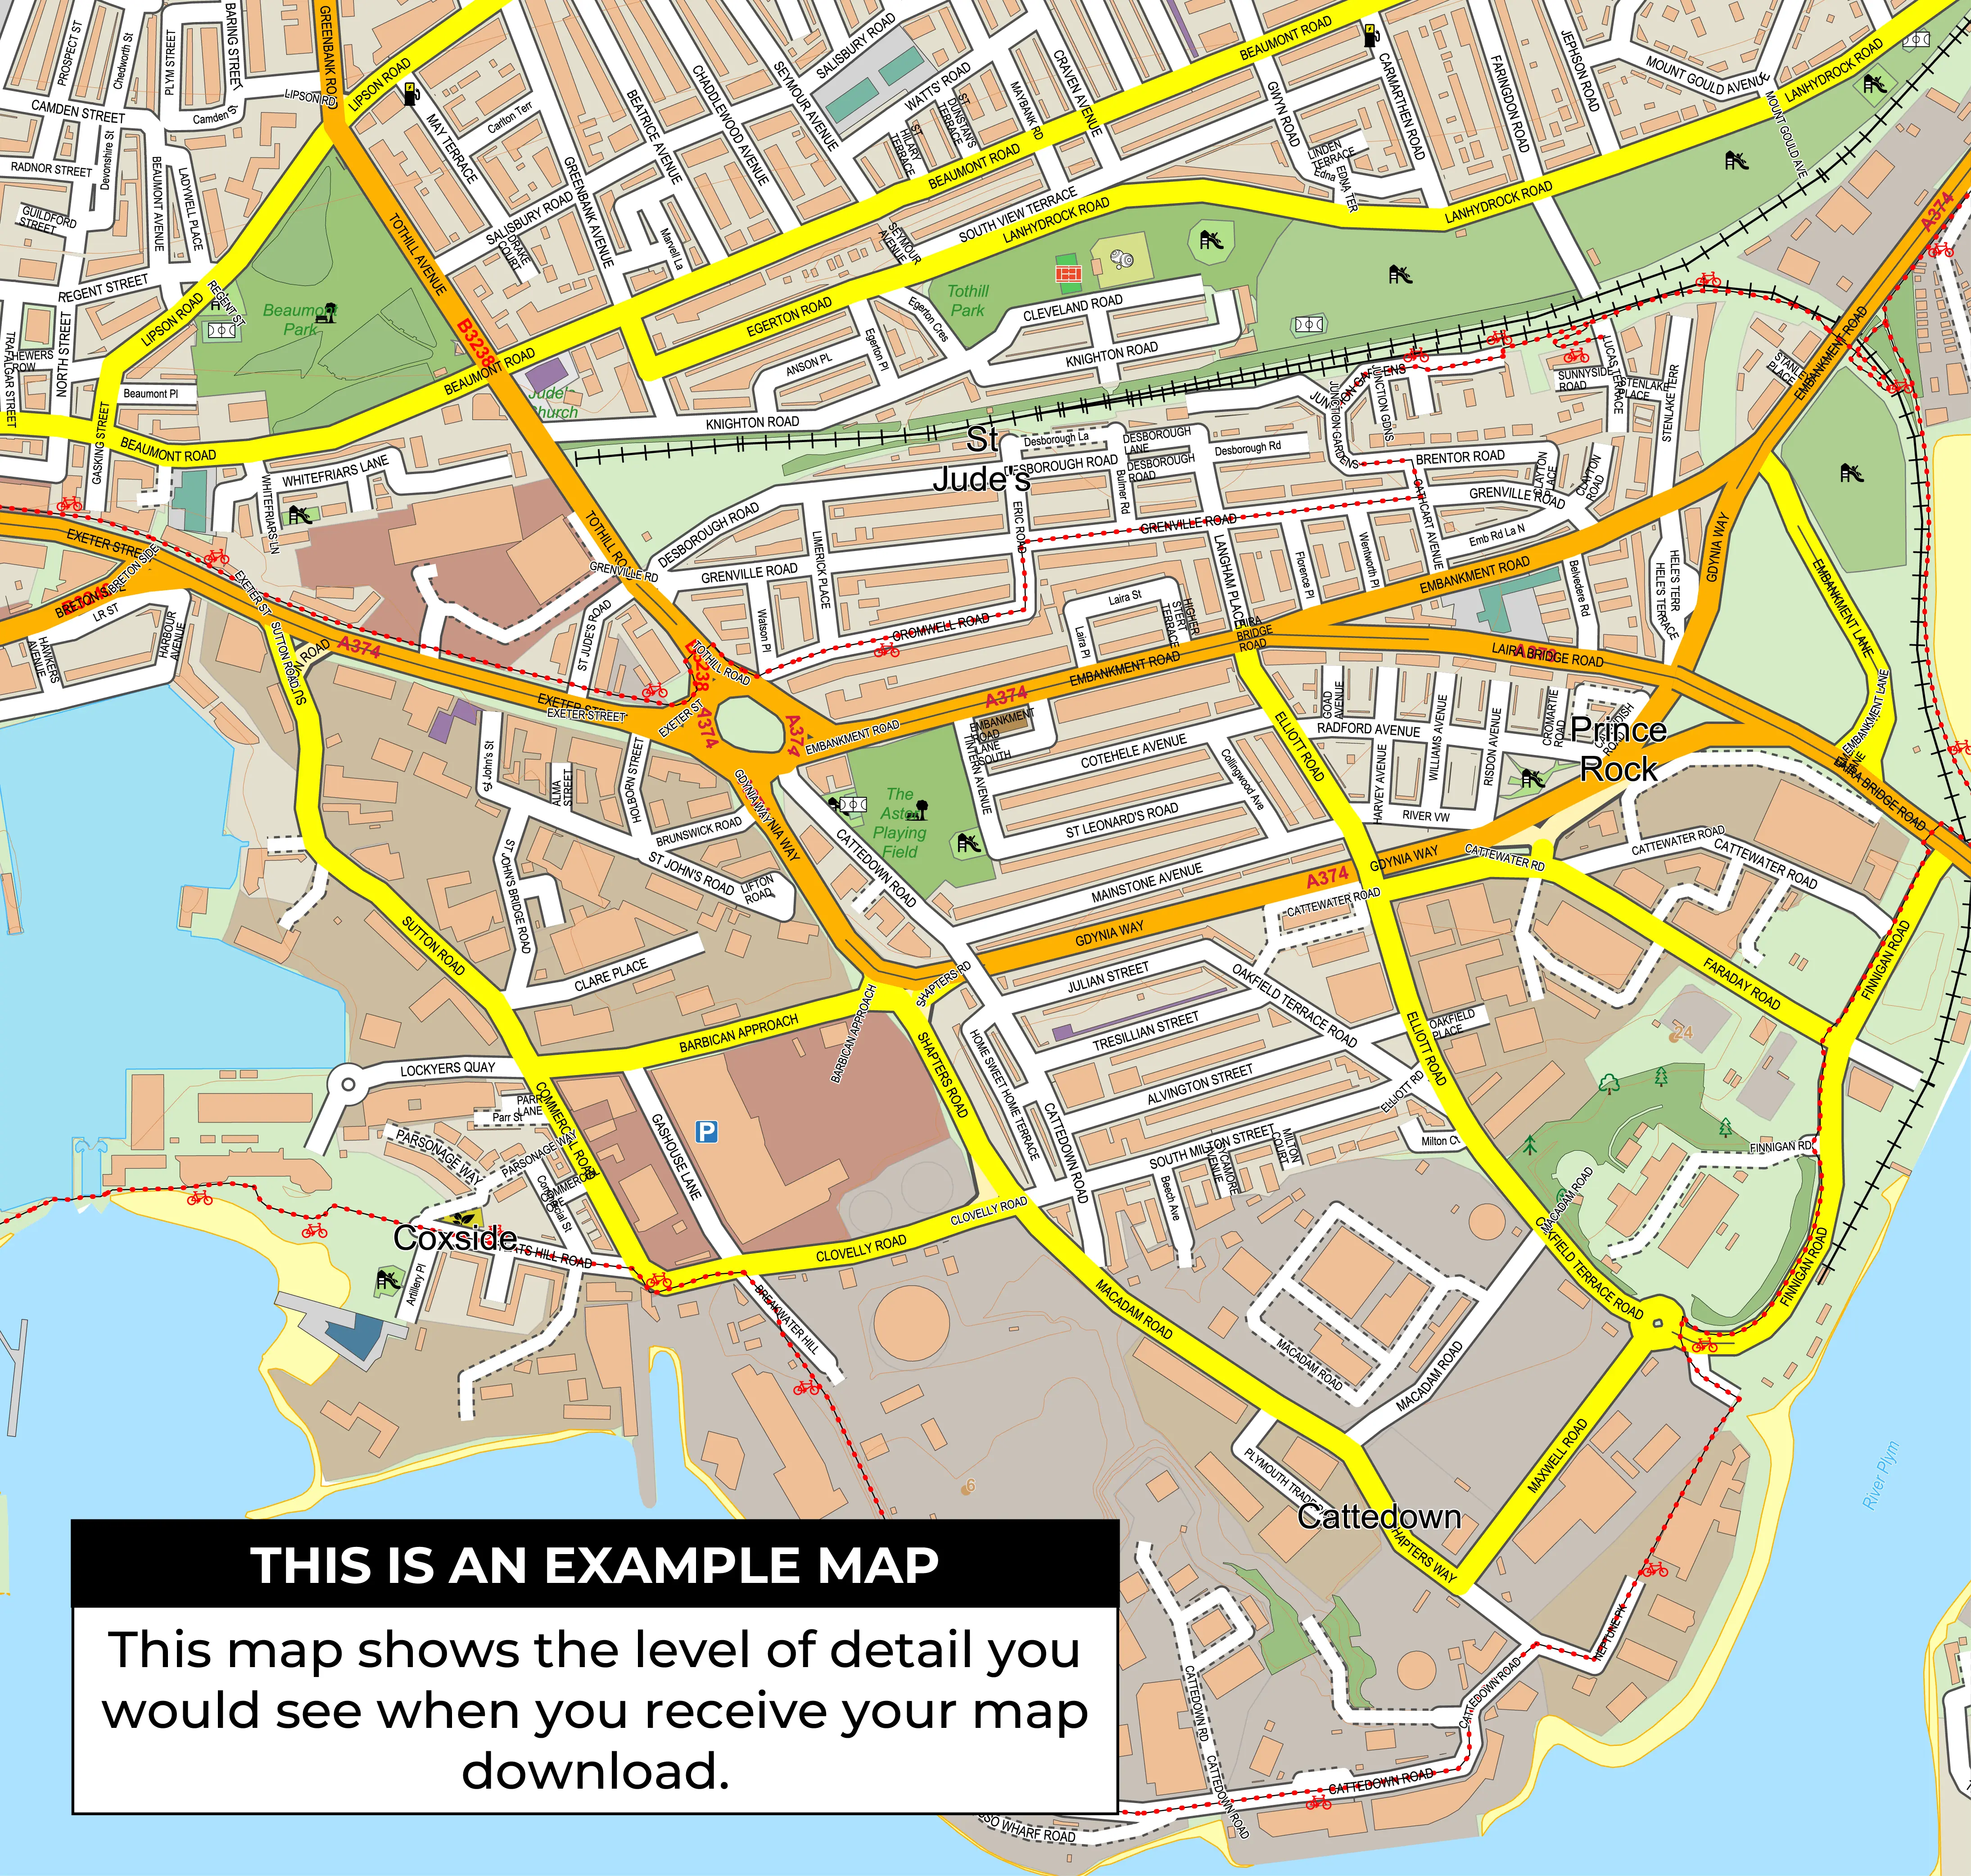
Westmorland and Lonsdale Constituency Map
View the Westmorland and Lonsdale constituency map, linked wards and parliamentary election results. Buy a digital map for £15 including VAT, or order a print.
Download or Order this Map
Digital map files cost £15.00 including VAT. Printed maps start at £41.00 including VAT and UK delivery.
Request a Custom MapFull UK Constituency Map
See parliamentary constituency boundaries across the United Kingdom on one map. Choose a digital download or a printed map for your wall.
Download £50 including VAT
Prints from £41.00 including VAT and UK delivery.
Constituency boundary changes
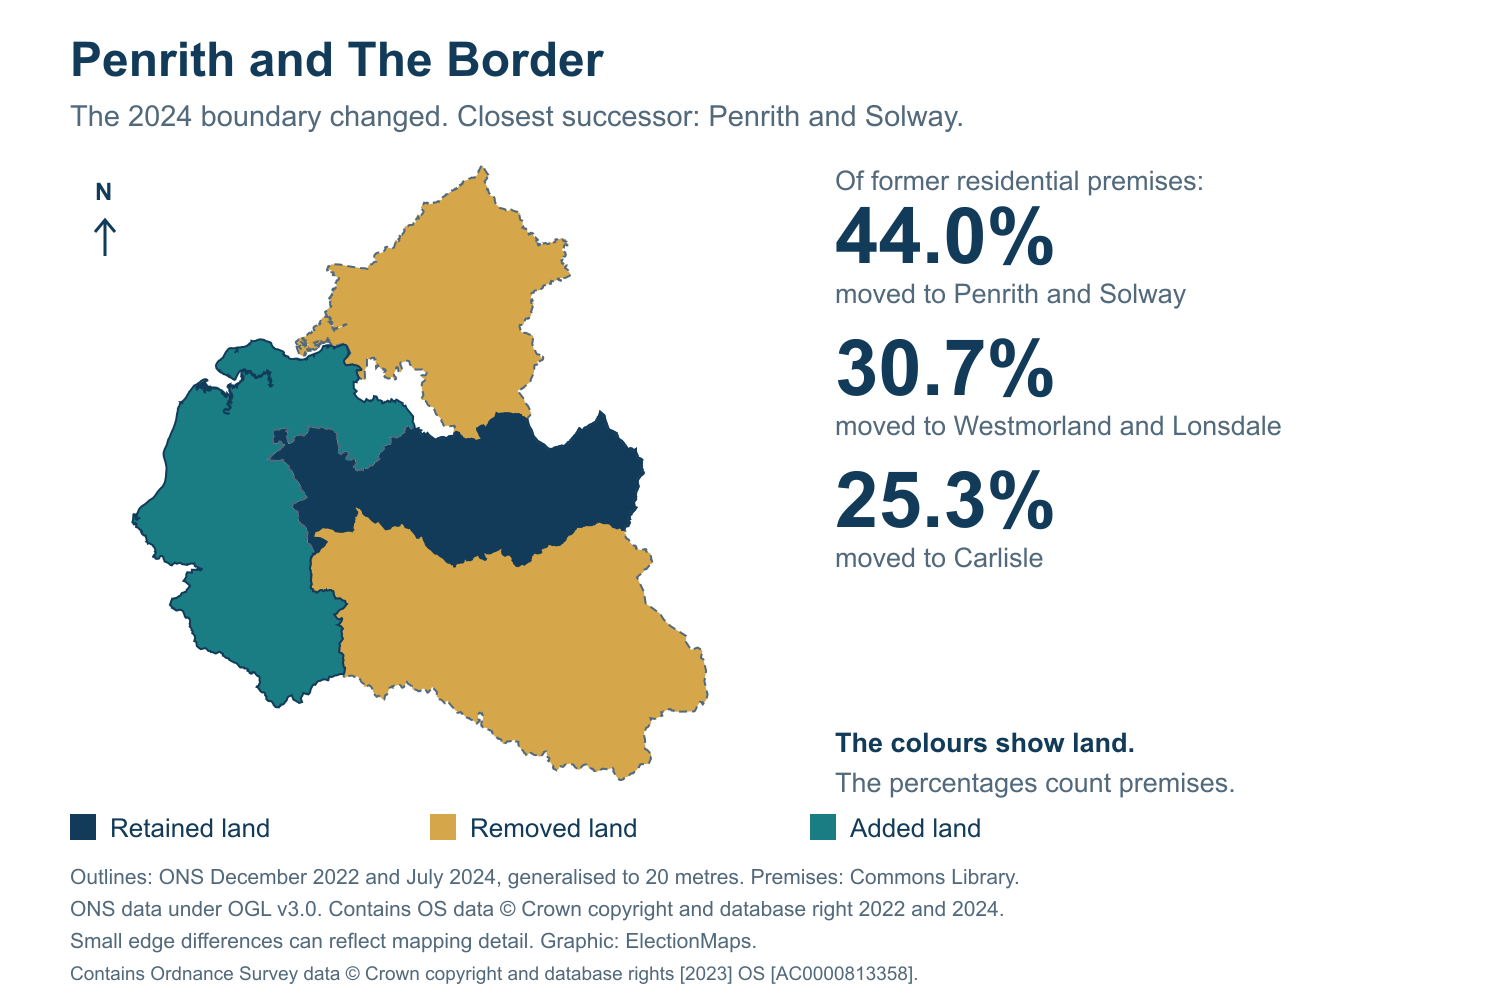
See which former constituencies make up this area. Each image compares a former constituency with its closest 2024 successor.
Browse constituency boundary changes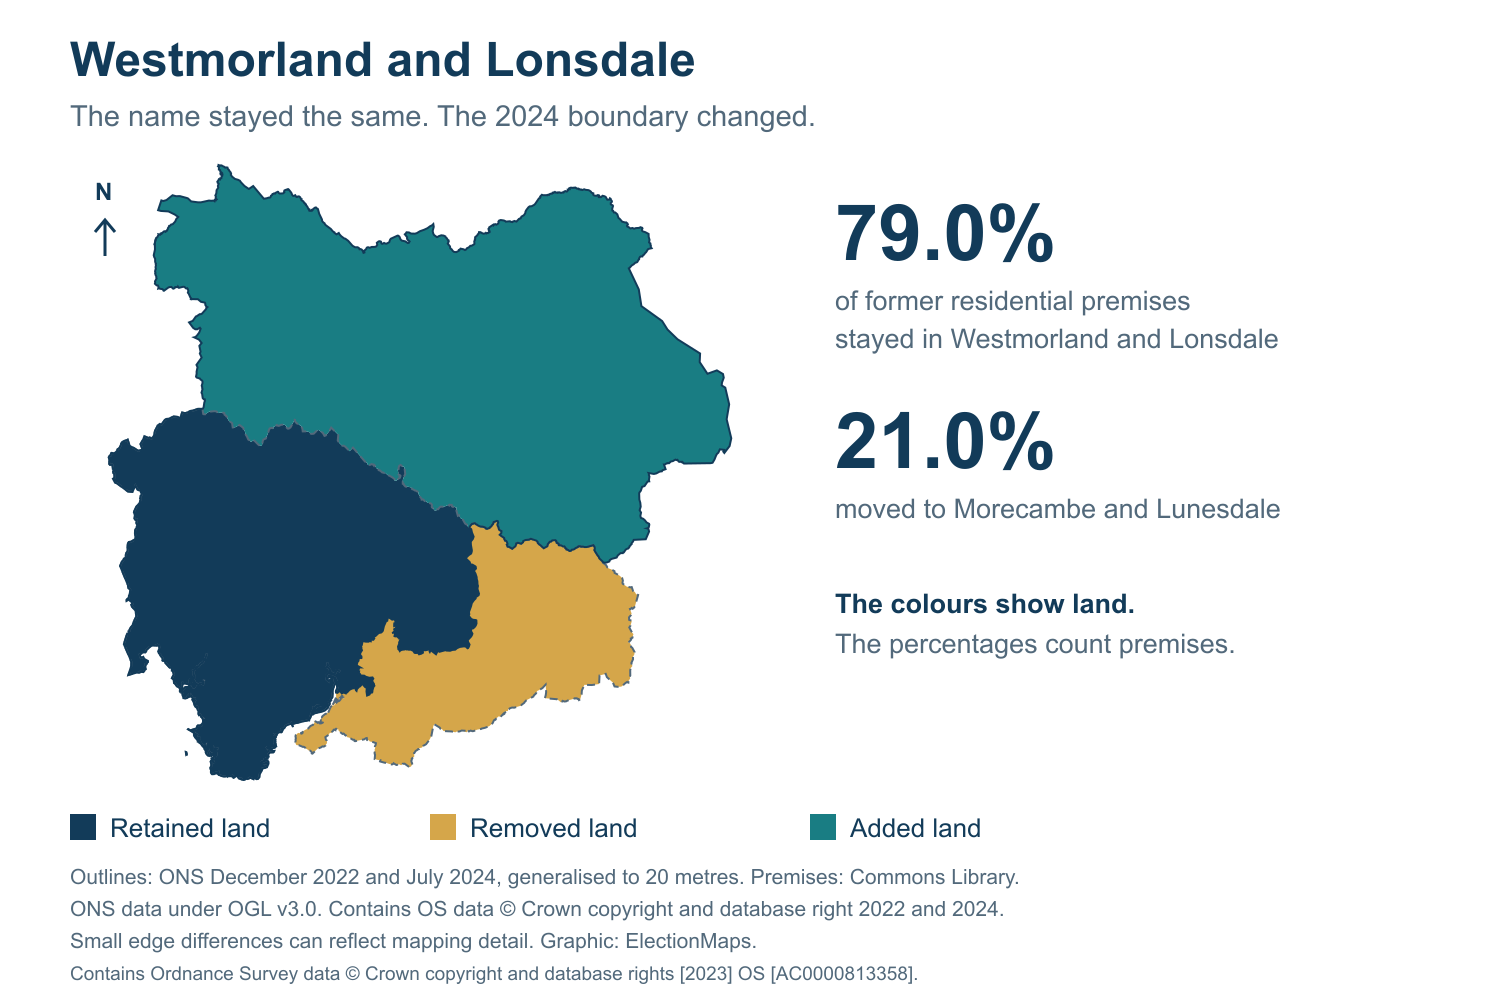
Westmorland and Lonsdale Constituency Facts
Westmorland and Lonsdale is a current Westminster parliamentary constituency in North West. The official current constituency code is E14001580, with 17 linked ward records and 4 split wards in the current ward link dataset.
| Constituency Name | Westmorland and Lonsdale |
| Constituency Code | E14001580 |
| Country | England |
| Region | North West |
| Ward Count | 17 |
| Split Ward Count | 4 |
Who Uses This Map?
The Westmorland and Lonsdale constituency map is useful for organisations and individuals who need a clear, detailed view of the constituency boundary, wards, roads and surrounding area.
Campaign Teams
Plan strategy, target voters and allocate resources.
Graphic Designers
Build infographics, ads and campaign materials.
Publishers
Create reports, guides and electoral publications.
Analysts
Analyse data, track results and identify trends.
Latest Parliamentary Election Result
The latest exact parliamentary result for Westmorland and Lonsdale in this dataset is the General held on 4 Jul 2024. Tim Farron won for Liberal Democrat with a recorded majority of 21,472.
Tim Farron
Liberal Democrat
Tim Farron won Westmorland and Lonsdale for Liberal Democrat. 31,061 votes. Majority 21,472.
Candidate Results
Candidate rows are matched to the latest area result using constituency_code, election_date and election_type. The table includes 8 candidates from 8 parties or groupings.
| Name | Party | Votes | Vote Share | Vote Change | Majority | Result |
|---|---|---|---|---|---|---|
| Tim Farron | Liberal Democrat | 31,061 | 62.71% | +22.03% | 21,472 | Elected |
| Matty Jackman | Conservative | 9,589 | 19.36% | -30.80% | Not available | Not Elected |
| James Townley | Reform UK | 4,842 | 9.78% | +8.67% | Not available | Not Elected |
| Pippa Smith | Labour | 2,306 | 4.66% | -2.27% | Not available | Not Elected |
| Phil Clayton | Green Party | 1,486 | 3.00% | +2.47% | Not available | Not Elected |
| John Studholme | Independent | 111 | 0.22% | Not available | Not available | Not Elected |
| Izzy Solabarrieta | Heritage Party | 81 | 0.16% | Not available | Not available | Not Elected |
| Wendy Long | Social Democratic Party | 57 | 0.12% | Not available | Not available | Not Elected |
Westmorland and Lonsdale Election Figures
These figures are from the parliamentary election on 4 Jul 2024 for constituency code E14001580.
Electorate
72,029Valid Votes
49,533Invalid Votes
115Turnout
68.93%Total Votes
49,648Majority
21,472Election History
Westmorland and Lonsdale has 5 parliamentary election rows in this table. Rows marked with an asterisk are historic boundary/name matches from older constituency codes and are labelled separately from exact E14001580 rows.
| Year / Date | Type | Winner | Party | Majority | Electorate | Total Votes | Match |
|---|---|---|---|---|---|---|---|
| 2024 / 4 Jul 2024 | General | Tim Farron | Liberal Democrat | 21,472 | 72,029 | 49,648 | Exact current code |
| 2019 / 12 Dec 2019 | General | Timothy Farron | Liberal Democrat | 1,934 | 67,789 | 52,853 | Historic boundary/name match |
| 2017 / 8 Jun 2017 | General | Tim Farron | Liberal Democrat | 777 | 66,391 | 51,768 | Historic boundary/name match |
| 2015 / 7 May 2015 | General | Tim Farron | Liberal Democrat | 8,949 | 65,857 | 49,052 | Historic boundary/name match |
| 2010 / 6 May 2010 | General | Tim Farron | Liberal Democrat | 12,264 | 66,988 | 51,569 | Historic boundary/name match |
Party Vote Trend
This chart compares recorded parliamentary election results. Rows marked with an asterisk are historic boundary/name matches from older constituency codes and are labelled separately from exact E14001580 rows.
Total Votes Trend
This chart tracks total parliamentary votes by election date where total vote figures are available.
Party Performance
Liberal Democrats recorded the highest party vote total in the latest exact-code election row, with 31,061 votes.
Liberal Democrats
31,06162.71% of valid votesConservative
9,58919.36% of valid votesReform UK
4,8429.78% of valid votesLabour
2,3064.66% of valid votesGreen
1,4863.00% of valid votesOther
2490.50% of valid votesPrevious Winners
Previous winners are shown from parliamentary election records. Results for older boundaries with the same constituency name are labelled as historic matches.
Wards in Westmorland and Lonsdale
These wards are linked to Westmorland and Lonsdale in the boundary data. A split ward is linked to more than one parliamentary constituency.
| Ward | Ward Code | Council / Local Authority | Status |
|---|---|---|---|
| Appleby and Brough | E05014218 | Westmorland and Furness | Whole ward |
| Bowness and Lyth | E05014219 | Westmorland and Furness | Whole ward |
| Coniston and Hawkshead | E05014221 | Westmorland and Furness | Split ward |
| Eamont and Shap | E05014224 | Westmorland and Furness | Whole ward |
| Eden and Lyvennet Vale | E05014225 | Westmorland and Furness | Whole ward |
| Grange and Cartmel | E05014226 | Westmorland and Furness | Whole ward |
| Greystoke and Ullswater | E05014227 | Westmorland and Furness | Whole ward |
| Kendal Castle | E05014231 | Westmorland and Furness | Whole ward |
| Kendal Highgate | E05014232 | Westmorland and Furness | Whole ward |
| Kendal Nether | E05014233 | Westmorland and Furness | Whole ward |
| Kendal South | E05014234 | Westmorland and Furness | Split ward |
| Kendal Strickland and Fell | E05014235 | Westmorland and Furness | Whole ward |
| Kirkby Stephen and Tebay | E05014237 | Westmorland and Furness | Whole ward |
| Levens and Crooklands | E05014238 | Westmorland and Furness | Split ward |
| Sedbergh and Kirkby Lonsdale | E05014245 | Westmorland and Furness | Split ward |
| Upper Kent | E05014247 | Westmorland and Furness | Whole ward |
| Windermere and Ambleside | E05014249 | Westmorland and Furness | Whole ward |
What constituency is Westmorland and Lonsdale?
Westmorland and Lonsdale is a current Westminster parliamentary constituency in North West. Its current constituency code is E14001580.
How many wards are in Westmorland and Lonsdale?
Westmorland and Lonsdale has 17 linked ward records in the current ward-to-constituency dataset.
Are any wards split in Westmorland and Lonsdale?
Yes. Westmorland and Lonsdale has 4 split ward records.
Who won the latest parliamentary election in Westmorland and Lonsdale?
Tim Farron won the latest exact-code parliamentary result recorded here.
Are local ward election results used as parliamentary results here?
No. Parliamentary results and local ward results are separate. The ward list shows how local wards relate to this constituency.
Why are some historic rows labelled as boundary/name matches?
Some 2010-2019 parliamentary rows use old constituency codes. Rows with the same constituency name but a different code are labelled as historic boundary/name matches rather than being treated as exact current-code results.