
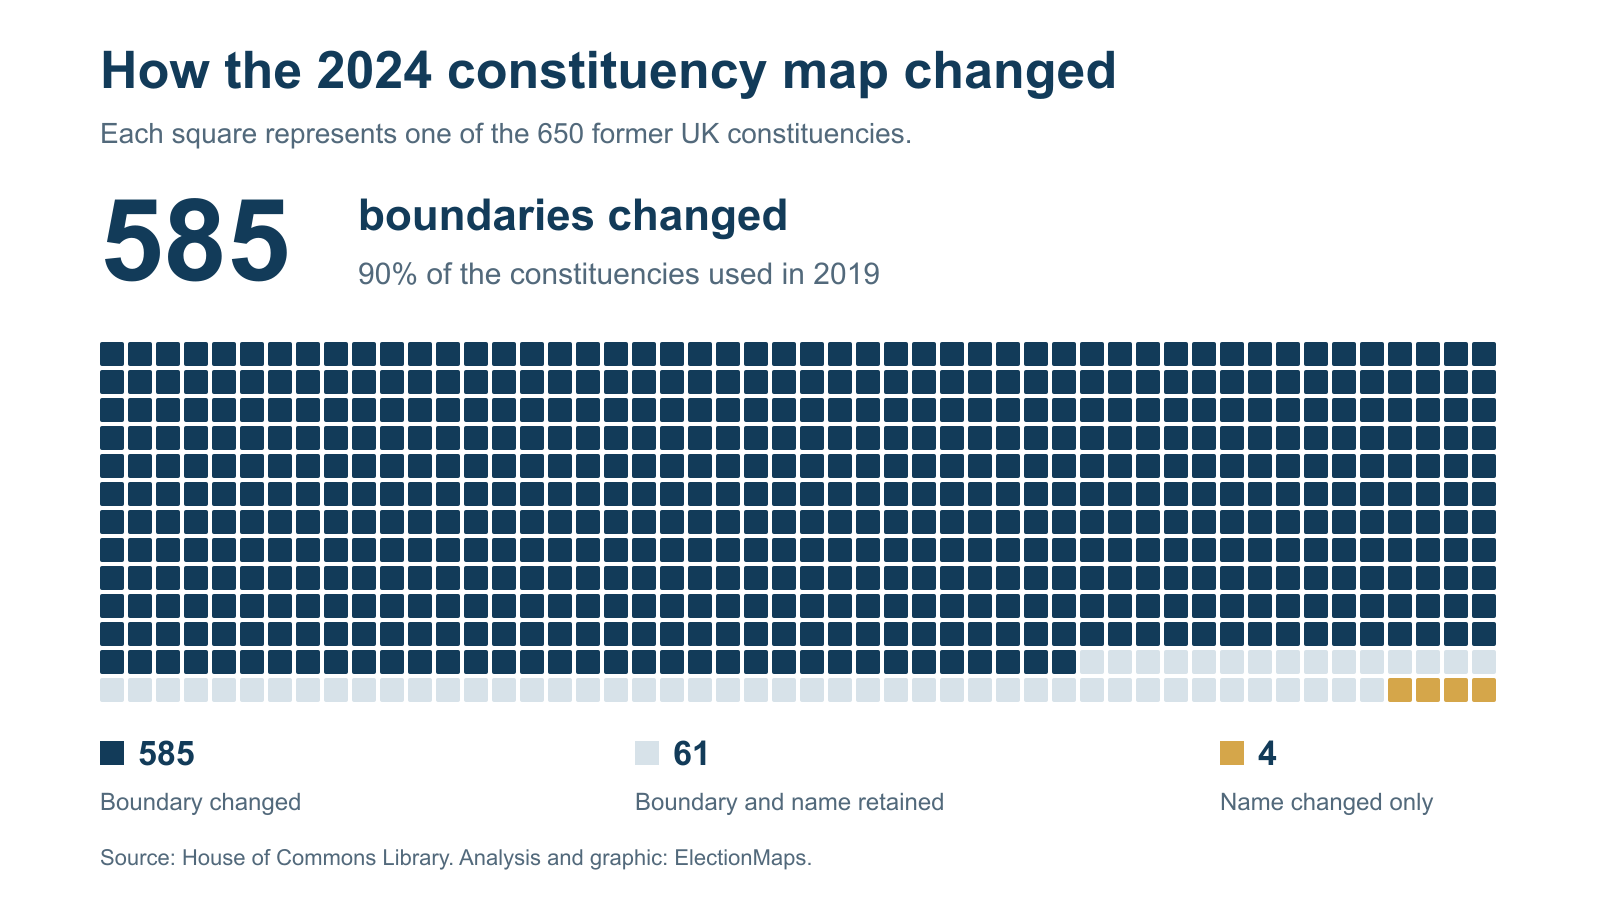
The 2024 general election was fought on a different map. Of the 650 constituencies used in 2019, 585 changed boundary. Wales went from 40 seats to 32. And in hundreds of places, a familiar constituency name covered a different area.
The changes are easy to miss in a results table. Newcastle upon Tyne North kept its name, but its successor contained only 41.3% of the former seat's residential premises. Hove gained “and Portslade” in its name while its boundary stayed the same. A name can suggest continuity or change without telling the reader what happened on the ground.
We checked all 650 former-seat profiles and 1,434 old-to-new overlaps in the House of Commons Library boundary workbook. This report covers the Westminster boundaries used at the 12 December 2019 and 4 July 2024 general elections, including Northern Ireland. The figures below describe that change, rather than later council or devolved legislature reviews.
Our constituency boundary change pages let you search for a seat, compare its old and new outlines, and follow the areas transferred to neighbouring constituencies. The examples below link straight to those maps.
The figures behind the new map
- 585 of 650 former seats changed boundary. That is 90%. The other 65 retained their boundaries; four of those received new names.
- 378 changed seats had a closest successor with the same name. A comparison based on names alone will miss these changes.
- 468 former seats had at least two destinations containing 1% or more of their residential premises each. This count uses unrounded shares and an explicit threshold.
- 25 former seats had no single destination containing half their residential premises. For these places, one successor outline cannot tell the whole story.
The national boundary counts use the Commons classification. The destination counts are our calculations from its premises shares. Residential premises are the measure used in the overlap tables; they are not a count of voters.
650 seats remained but their distribution changed
England gained ten constituencies. Scotland lost two and Wales lost eight. Northern Ireland retained 18. The UK total remained 650, as recorded by Parliament's constituency guide and the Boundary Commissions' final reports.
Wales had the largest proportional reduction: eight seats out of 40, or 20%. Yet a stable national allocation did not guarantee stable local boundaries. All 18 former Northern Ireland constituencies had some boundary change. In Wales, 39 of the 40 former seats changed.
Scroll the table to see all columns.
| Country | 2019 seats | 2024 seats | Net change | Former boundaries changed | Former boundaries retained |
|---|---|---|---|---|---|
| England | 533 | 543 | +10 | 478 | 55 |
| Scotland | 59 | 57 | -2 | 50 | 9 |
| Wales | 40 | 32 | -8 | 39 | 1 |
| Northern Ireland | 18 | 18 | +0 | 18 | 0 |
| UK total | 650 | 650 | 0 | 585 | 65 |
The last two columns classify the former constituencies. They sum to the 2019 allocation, not the 2024 allocation. “Retained” includes seats that changed name without changing boundary.
Why the boundaries changed
The review sought a more equal number of registered Parliamentary electors in each constituency. It used electoral registers from 2 March 2020. The electoral quota was 73,393, with a usual permitted range of 69,724 to 77,062 electors. The Boundary Commission for England's final report sets out the calculation and the rules.
Five island seats had protected status: Orkney and Shetland, Na h-Eileanan an Iar, Ynys Môn, Isle of Wight East and Isle of Wight West. The legislation also allows limited exceptions for very large constituencies and Northern Ireland. Within the rules, the Commissions considered factors such as geography, local ties and existing boundaries.
The four Commissions published their final recommendations in June 2023. The Parliamentary Constituencies Order 2023 was made on 15 November and came into force on 29 November. The new seats were first used at the 4 July 2024 general election. By-elections before Parliament was dissolved still used the old seats. This explains why a “2023 review” changed the election map in 2024.
A familiar name can hide a substantial change
The Commons closest-successor pairings contain 378 cases where a changed constituency kept the same name. Newcastle upon Tyne North is a clear example. Only 41.29% of its former residential premises were in the new North seat. A further 41.20% went to Newcastle upon Tyne Central and West, 12.20% to Hexham, and 5.31% to Cramlington and Killingworth.
The near-equal first two shares matter. A journalist who matched Newcastle upon Tyne North's 2019 and 2024 results by name would be comparing substantially different areas. The Newcastle upon Tyne North comparison shows all four destinations.
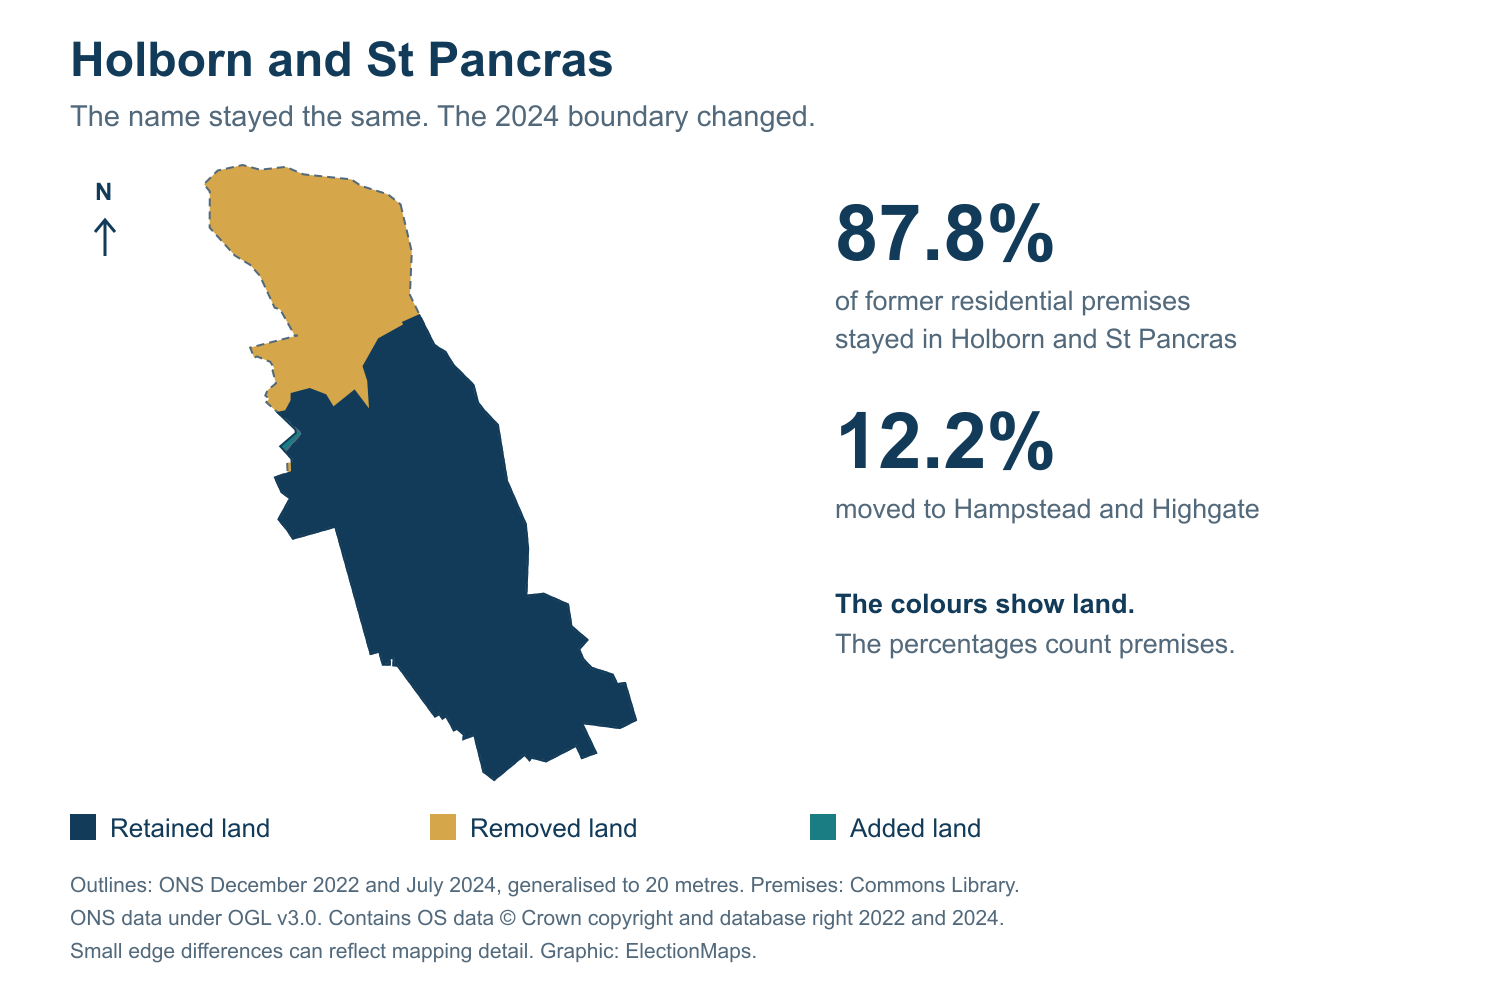
Holborn and St Pancras also kept its name. Its successor contained 87.8% of the old seat's residential premises. The remaining 12.2% went to Hampstead and Highgate. The boundary map makes the reduction visible; the premises table shows how much of the former address base was affected.
A new name can accompany a retained boundary. Four former constituencies had exactly this outcome. All four are in England.
Scroll the table to see all columns.
| Name used in 2019 | Name used from 2024 |
|---|---|
| Burton | Burton and Uttoxeter |
| Hove | Hove and Portslade |
| North Warwickshire | North Warwickshire and Bedworth |
| Oldham West and Royton | Oldham West, Chadderton and Royton |
These four examples are a useful check against counting every new constituency name as a new geographical area. Hove's comparison page records the retained boundary and the new Hove and Portslade name.
Where a single successor gives an incomplete picture
Many former seats contributed to more than one new constituency. To make this count useful, we counted a destination only when it contained at least 1% of the former seat's residential premises. On that basis, 468 of the 650 former seats had two or more destinations. Of those, 151 had three or more.
Scroll the table to see all columns.
| Qualifying destinations | Former constituencies | Share of all 650 former seats |
|---|---|---|
| 1 | 182 | 28.0% |
| 2 | 317 | 48.8% |
| 3 | 124 | 19.1% |
| 4 | 22 | 3.4% |
| 5 | 5 | 0.8% |
The threshold is our analytical choice. It gives small transfers a clear treatment. With any positive premises share, 500 former seats have multiple destinations. With a 5% minimum per destination, the count is 391. These figures answer different questions about the size of a split.
Wyre and Preston North is the strongest five-way example. It is the only former constituency whose residential premises were spread across five destinations, each receiving at least 10%. The largest share, going to Ribble Valley, was 31.09%.
Scroll the table to see all columns.
| Constituency from 2024 | Share of the former seat's premises |
|---|---|
| Ribble Valley | 31.09% |
| Lancaster and Wyre | 25.39% |
| Fylde | 16.76% |
| Blackpool North and Fleetwood | 15.18% |
| Preston | 11.59% |
The Wyre and Preston North comparison page starts with Ribble Valley, the Commons closest successor. Its full destination table is essential here. A map of that pair alone would leave four parts of the former seat unexplained.
There are substantial splits elsewhere. Former Glasgow Central has five destinations above the 1% threshold. Former Ogmore has four above that threshold and a fifth just below it. Cardiff West received 0.9911% of Ogmore's former premises. That rounds to 1.0% at one decimal place, but it remains below 1% in the calculation.
The downloadable data retains the unrounded figures. This matters when a threshold decides which side of a table a constituency appears on.
The same transfer can produce two different percentages
The Barnsley Central comparison illustrates a common source of confusion. Barnsley North received 86.8% of the former Barnsley Central seat's residential premises. Barnsley South received the other 13.2%.
But former Barnsley Central supplied only 76.8% of the new Barnsley North seat's premises. The other 23.2% came from former Barnsley East. Both the 86.8% and 76.8% figures describe the same overlap. One divides by the old seat's total; the other divides by the new seat's total.
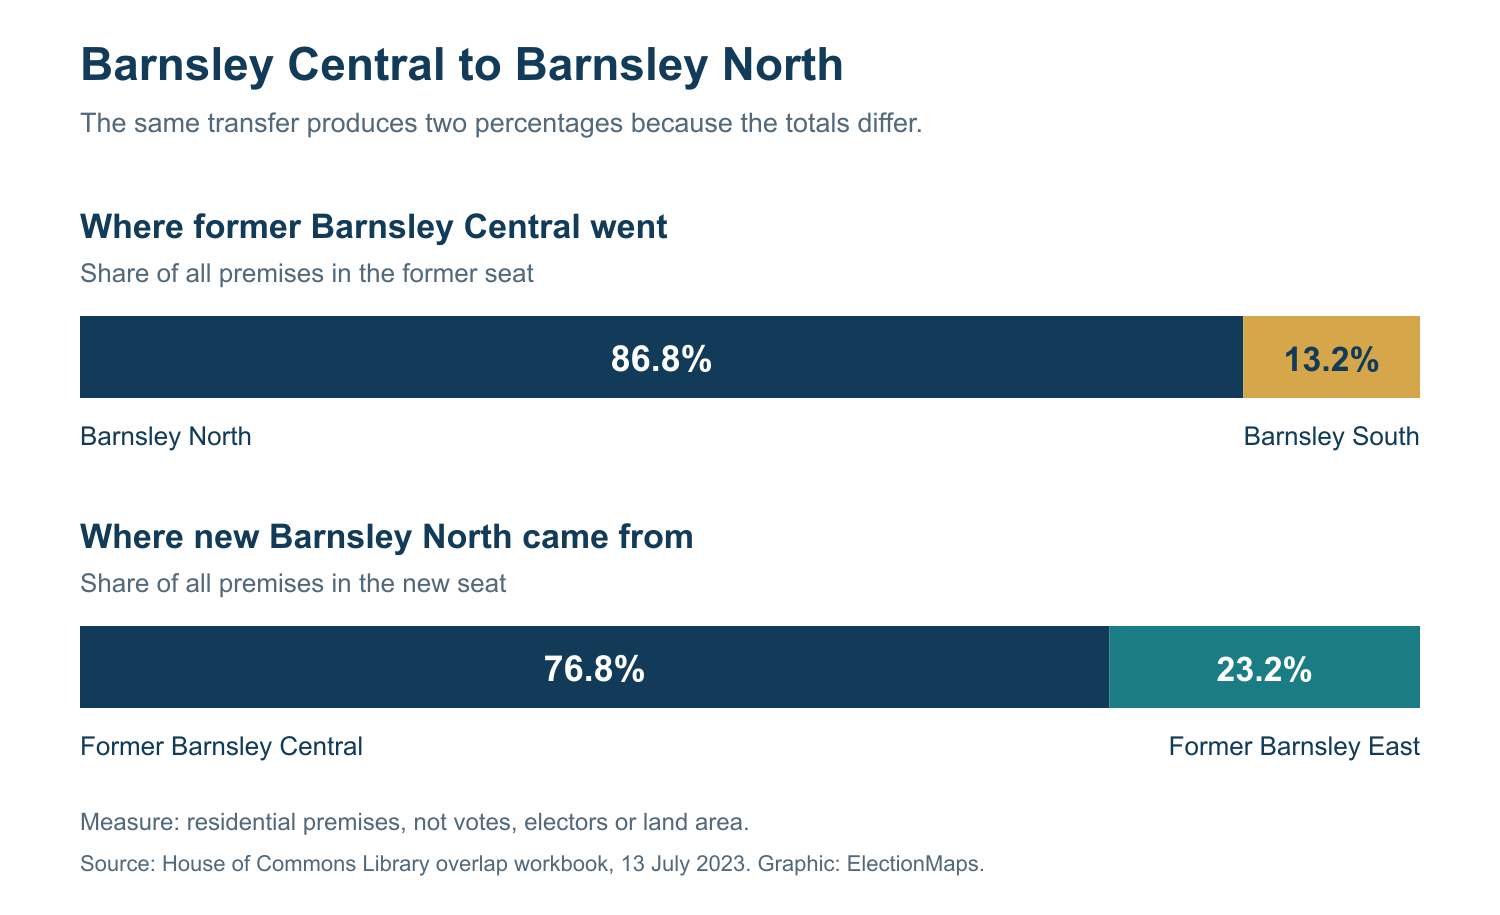
Our comparison pages place these questions side by side: “Where did the old area go?” and “Where did the new area come from?” Read the heading before using a percentage in a story. A transfer means an address was assigned to a different parliamentary constituency; it does not imply that anyone moved house.
The map colours answer a geographical question. They show land retained, removed or added when the two boundary outlines are compared. A large rural area can contain relatively few premises. The workbook's premises percentages cannot be read directly from the coloured area of a map.
How to compare election results after a boundary change
A change in constituency vote share can reflect both electoral change and a different set of electors. Matching the seat name does not remove that problem. For a comparison of local results, use a notional 2019 result calculated on the 2024 boundaries, and label it as an estimate.
Parliament publishes the notional 2019 results used for this purpose. They were commissioned jointly by BBC News, ITV News, Sky News and PA. The estimates use evidence about how support was distributed within the former seats. The boundary workbook itself does not contain those estimated votes.
Westmorland and Lonsdale shows why this matters. The Liberal Democrats won the actual seat in 2019. The notional 2019 result for its 2024 boundary has a Conservative winner. The Commons Library's analysis of the 2024 election explains this difference. A record of the actual 2019 result and a notional comparison can therefore give different descriptions of the 2024 contest.
The Westmorland and Lonsdale boundary page shows the geographical reason to check. Its successor contained 79.0% of the former seat's premises. In the other direction, former Westmorland and Lonsdale supplied 73.1% of the new seat's premises; 26.9% came from Penrith and The Border.
A notional result helps make the areas comparable. It cannot recover the exact vote of every person in a transferred area. Keep actual election results, estimated results and boundary overlaps clearly labelled in any published table.
Find the changes in your constituency
The ElectionMaps boundary change directory covers all 650 former constituencies. Search by a former name or a linked current name. Each comparison page combines the map with the figures needed to explain it.
- Compare the outlines. Switch between the old boundary, the boundary used from 2024, and the view showing the changes.
- Check all destinations. The first map pairs the former seat with the Commons closest successor. The destination table shows where the rest of the former area went.
- Read the other direction. The incoming table shows which former constituencies contributed to the successor.
- Check the dates. The source panel identifies the boundary snapshots and workbook. Ward membership lists use 2023 ward boundaries.
For a report, presentation or printed leaflet, the comparison pages also offer vector map files and printed maps. Vector files are prepared and sent by email after purchase. For a map with your own labels or a different area, contact ElectionMaps.
Search the constituency boundary comparisons
How we checked the figures
We used the Commons Library workbook dated 13 July 2023, with its 650 former-seat summaries and 1,434 old-to-new overlap records. A fresh copy downloaded on 4 October 2026 matched the source file used for our boundary pages. All 650 summaries and all 1,434 overlaps passed the source comparison. The download below records the file hashes and checked fields.
The changed-boundary count comes from the Commons summary descriptions. It is not inferred from differences between generalised map outlines or from a percentage rounded to 100.0%. The name comparison uses the former seat and its supplied closest successor, with case, accents and punctuation standardised.
The destination counts use residential-premises shares with the former seat as the denominator. We apply thresholds to unrounded values. The workbook includes 22 overlap rows with no residential premises; these do not enter a positive-premises destination count. All premises shares reconcile to 100% for each former seat and each new seat.
We retain the Commons choice of closest successor. In six cases it differs from the destination with the largest residential-premises share. The source's population measures have different dates and coverage limits, which are recorded in the data notes. This report uses premises for the transfer percentages and destination counts.
The map uses ONS December 2022 and July 2024 outlines, generalised to 20 metres. Map differences and premises overlaps are separate calculations. Small edge differences can reflect cartographic detail. The map carries the ONS and Ordnance Survey attribution required by the source licence.
Download the report and data
- Word report with the tables, figures and source links.
- All 650 former constituency profiles as CSV, including closest successors, shares and comparison links.
- All 1,434 old-to-new overlap records as CSV, with both directions of each premises share.
- Method, national totals and source checks as JSON.
The CSV percentage columns are on a 0–100 scale and retain more precision than the article. Population fields that cannot be calculated are blank. Use the premises fields for the calculations described here. Source terms apply to the underlying data and mapping.
Sources
- House of Commons Library: Boundary review 2023 analysis and boundary comparison workbook, dated 13 July 2023. Summary and closest successors; All overlaps. Data checked on 4 October 2026. Contains Ordnance Survey data © Crown copyright and database rights [2023] OS [AC0000813358].
- Boundary Commission for England: 2023 final report and review rules. The other final reviews are published by the Commissions for Scotland, Wales and Northern Ireland.
- Parliamentary Constituencies Order 2023 and the Commons Library briefing on boundary reviews for implementation and exceptions.
- UK Parliament: notional 2019 election results. House of Commons Library: 2024 general election marginality, including the Westmorland and Lonsdale example.
- Office for National Statistics: December 2022 constituency outlines and July 2024 outlines. See our geometry sources and processing notes. Source: ONS licensed under the Open Government Licence v3.0. Contains OS data © Crown copyright and database right 2022 and 2024.