
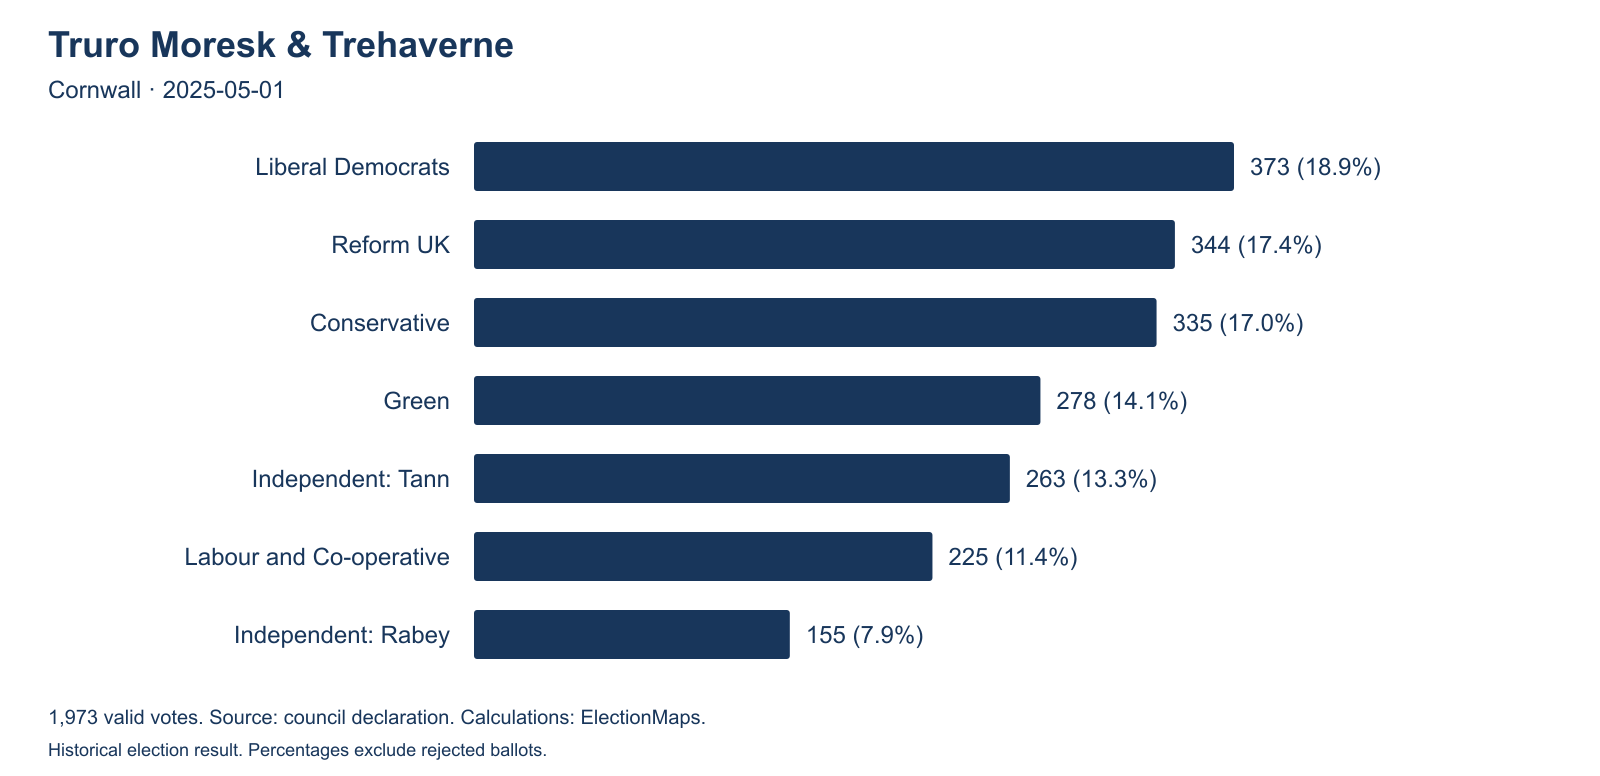
In Astley Bridge, Bolton, 1,560 votes beat 1,559. In Pontyclun East, the result was 240 to 239. In a Truro council division, seven candidates split the vote so widely that 373 votes were enough to win.
These places show two ways a local electorate can divide. Some contests leave almost no gap between the leading candidates. Others spread support across so many choices that the winner takes only a small share of the vote.
This study examines 6,839 historical election records. It covers 6,492 contested elections for one vacancy in England and Wales from 2022 to 2025. It also covers first preferences in 347 Scottish wards in 2022. It includes wards and some unitary council electoral divisions. The tables rank this defined sample. They do not claim to identify every divided ward in Britain, or describe voting intentions in 2026.
The vote totals come from local election result workbooks published by the House of Commons Library and the Electoral Management Board for Scotland. We checked the English and Welsh candidate votes against fresh copies of the source workbooks. We also checked the main case studies against council result notices. The full data and method are available below.
The figures behind the story
- 14 records show a one-vote gap in the published totals. One further record has equal totals at the top.
- 118 contests had a published gap of ten votes or fewer. That is 1.82% of the England and Wales sample.
- 165 contests had a published gap below one percentage point. We divide the gap by the sum of the published candidate totals.
- 33 winning shares were below 30% in the published totals. In 2,514 contests, the winner received less than half.
- 99 Scottish wards had at least four effective electoral choices. This measure accounts for both the number of choices and the size of their support.
Published totals can include a deemed extra vote after a tied poll. The note below the first table explains this rule. Each English or Welsh entry is an election contest. Some wards appear in more than one year. The totals therefore count contests, not a matching number of distinct communities.
The contests that came down to a handful of votes
Astley Bridge provides the clearest one-vote example once the size of the poll is taken into account. At the 2 May 2024 election, Conservative Toby Hewitt received 1,560 votes. Labour and Co-operative candidate Kate Elizabeth Taylor received 1,559. Green candidate Mark Devereux had 555 and Mike Armstrong, standing as Reform UK and Bolton for Change, had 433.
The gap was one vote out of 4,107 valid votes, or 0.0243 percentage points. The first two candidates together took 75.94% of the valid votes. A ward can have a close contest between two large parties while a quarter of its voters choose someone else.
Thorpe, in Southend-on-Sea, was another one-vote contest in 2022. Independent Martin William Terry received 1,230 votes and Conservative Mohammed Azeem Raja received 1,229. The signed council declaration records the result. The first two candidates accounted for 79.14% of 3,107 valid votes.
The smallest gap in the sample was zero. In Skipton West and West Craven in 2022, Independent Andy Solloway and Labour's Peter Madeley both received 503 votes. Conservative Patrick Mulligan was only two votes behind, on 501. Solloway won the tie through a draw. ITV's report from the count records how the candidates used straws to settle the result. This was an electoral division, rather than a district council ward.
Scroll the table to see all columns.
| Ward or division and council | Year | Published totals for first two candidates | Published gap | Gap in percentage points |
|---|---|---|---|---|
| Skipton West and West Craven North Yorkshire | 2022 | Ind 503 Lab 503 | 0 | 0.0000 |
| Astley Bridge Bolton | 2024 | Con 1,560 Lab 1,559 | 1 | 0.0243 |
| Thorpe Southend-on-Sea | 2022 | Ind 1,230 Con 1,229 | 1 | 0.0322 |
| The Strettons Shropshire | 2025 | LD 695 Ind 694 | 1 | 0.0498 |
| Beighton Sheffield | 2024 | LD 1,355 Lab 1,353 | 2 | 0.0552 |
| Bridgnorth South & Alveley Shropshire | 2025 | LD 509 Reform 508 | 1 | 0.0808 |
| Park Peterborough | 2024 | Lab 827 Con 825 | 2 | 0.0813 |
| Castle Herefordshire | 2023 | Con 346 Ind 345 | 1 | 0.0826 |
| Bridgnorth West & Tasley Shropshire | 2025 | Ind 383 Reform 382 | 1 | 0.0840 |
| Daresbury, Moore & Sandymoor Halton | 2022 | Con 399 Lab 398 | 1 | 0.0855 |
| Pontyclun East Rhondda Cynon Taf | 2022 | Ind 240 Con 239 | 1 | 0.0991 |
| Festival Gardens Liverpool | 2023 | Lab 358 Green 357 | 1 | 0.1018 |
Con means Conservative, Lab means Labour, LD means Liberal Democrats, and Ind means Independent. The first listed candidate was elected. The table preserves the source totals. A tied poll can appear as a one-vote published gap after the winner receives a deemed extra vote. Figures use unrounded totals for the ranking.
The Strettons electoral division, in Shropshire, gives the next large one-vote example. In 2025, Liberal Democrat Mark Morris received 695 votes and Independent Andrew Munro received 694. Shropshire had three more records with one-vote published gaps in the wider sample: Bridgnorth South and Alveley, Bridgnorth West and Tasley, and Sundorne and Old Heath. The council publishes the signed declaration for The Strettons.
Bridgnorth South and Alveley needs a separate note. BBC reporting records a tie on 508 votes each, followed by a draw. The council publishes Taylor on 509 and Webb-James on 508. Under Electoral Commission guidance, the winner of a draw is treated as having an additional vote. This is a published counting total, rather than an extra ballot cast by a voter.
Pontyclun East had five serious contenders
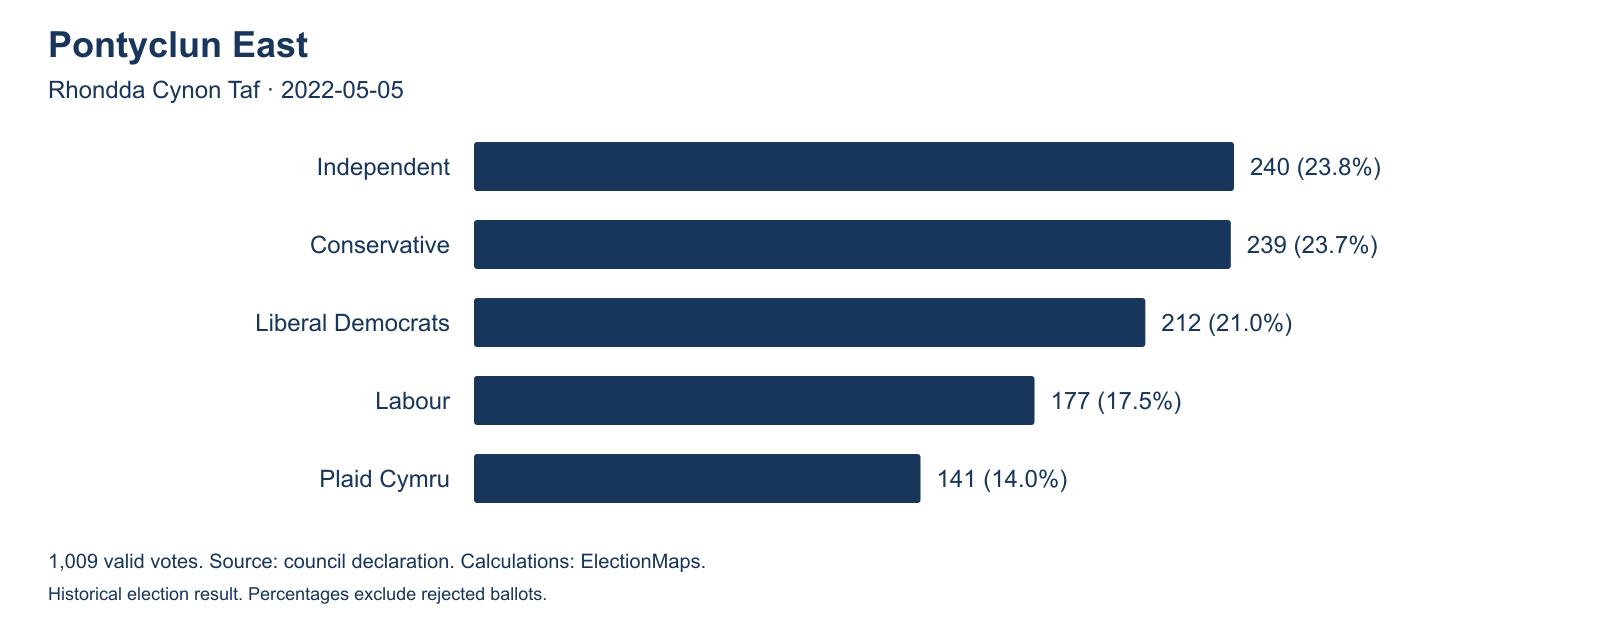
A one-vote gap can also occur in a crowded field. In Pontyclun East on 5 May 2022, Independent Paul Binning received 240 votes. Conservative Lewis Hooper received 239. Liberal Democrat Steven Rajam had 212, Labour's Matthew Lewis had 177, and Plaid Cymru's Carole Ann Willis had 141. These are the figures in Rhondda Cynon Taf's official result.
No candidate reached 24%. All five reached 13.9%. The winner and runner-up together had 47.47% of the valid votes. More voters chose one of the other three candidates than chose the leading two.
The result was close at the top and spread across the whole field. That makes Pontyclun East a stronger example of several competing groups of voters than a two-candidate contest that ends 50.1% to 49.9%.
Add a photograph taken within the 2022 ward boundary. Use a neutral street or community view. Supply the photographer's name, permission to publish, and a location caption.
Truro shows how little support can be enough to win
In Truro Moresk and Trehaverne on 1 May 2025, Liberal Democrat Steven Mark Webb won with 373 votes. Reform UK's Simon Rogers received 344 and Conservative Christopher Wells received 335. Only 38 votes separated first from third.
The rest of the field was substantial. Green candidate Lindsay Diane Southcombe had 278 votes and Independent Jonathan Peter Tann had 263. Labour and Co-operative candidate Rebecca Joan Eva had 225. Independent Sam Rabey had 155. The Cornwall Council election records give the full declaration.
Webb's winning share was 18.91%. The other six candidates received 1,600 votes between them. The top three combined had 53.32% of the valid votes. The two Independent candidates are separate choices in this study. Their shared ballot description does not make them a party.
Other 2025 results show a similar spread. In Constantine, Mabe and Mawnan, Reform UK won with 422 votes out of 1,799, a 23.46% share, according to the council declaration. The Conservative candidate had 409 votes, Labour 292, an Independent 273, the Liberal Democrats 263, and Mebyon Kernow 140. In Amble West with Warkworth, Northumberland, Reform UK won with 397 votes out of 1,671, or 23.76%. The signed result notice confirms the figures.
These results show how a candidate can win when several other candidates each retain meaningful support. They do not show how those voters would behave in a two-candidate race. Nor do they establish that every voter who chose someone else opposed the eventual winner.
Add an ElectionMaps boundary map for the division used on 1 May 2025. Mark the outer boundary clearly. Caption it with the election date and the boundary data source.
Where the vote was spread most widely
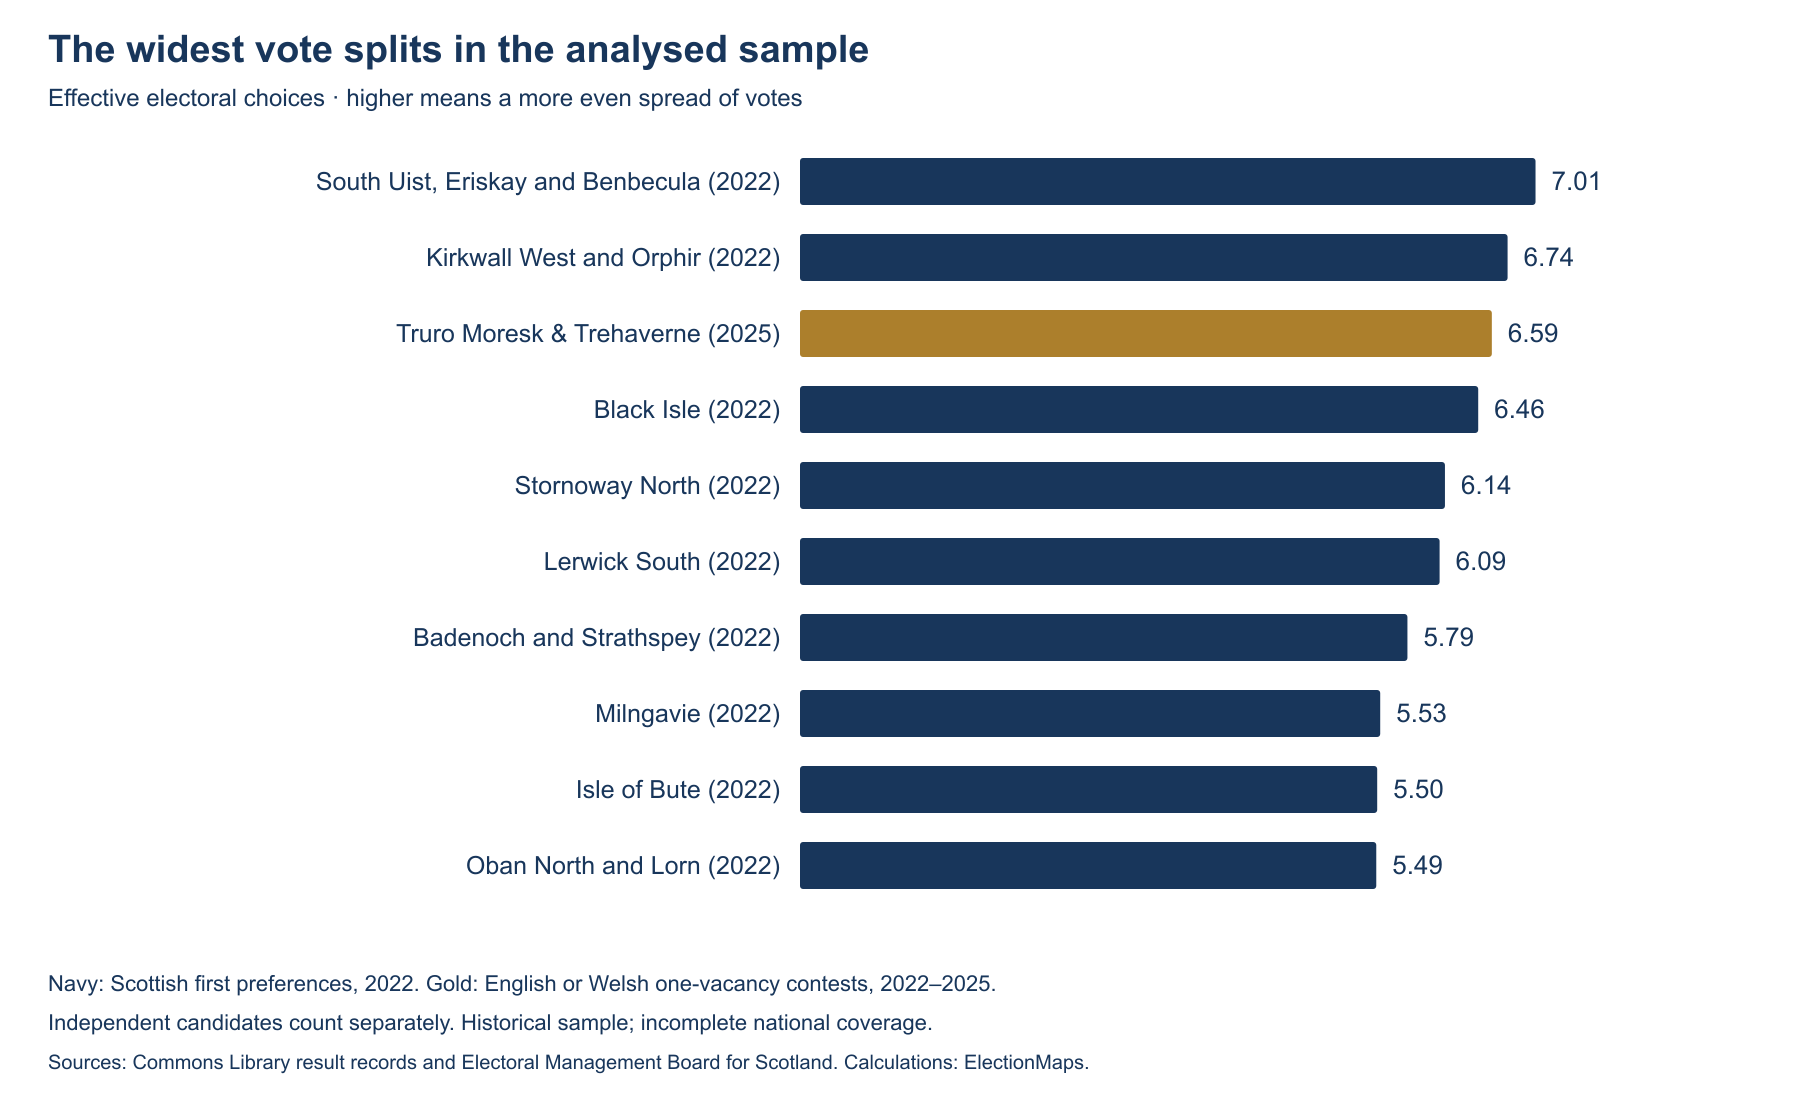
Counting the candidates alone gives a poor measure of a split vote. Ten candidates can stand while one receives 90% of the votes. We therefore calculate the number of effective electoral choices. Two equal choices give a score of 2. Five equal choices give a score of 5. A field with one large choice and several small ones gives a lower score than a field of the same size with evenly shared support.
The top record in this sample is Uibhist a Deas, Èirisgeigh agus Beinn na Faoghla. This is the South Uist, Eriskay and Benbecula ward in the Western Isles. Its 2022 first preferences give a score of 7.01. The largest choice received 21.06% of valid first preferences. Kirkwall West and Orphir follows at 6.74. Truro Moresk and Trehaverne is the highest English or Welsh record, at 6.59.
Several island wards appear near the top. This needs care. Much of the choice there is between Independent candidates. A broad spread of votes between Independents does not establish a sharp ideological split. It shows that voters backed several separate candidates.
Scroll the table to see all columns.
| Rank | Ward or division | Valid votes | Largest choice | Effective choices |
|---|---|---|---|---|
| 1 | South Uist, Eriskay and Benbecula Comhairle nan Eilean Siar, 2022 | 1,306 | 21.06% | 7.01 |
| 2 | Kirkwall West and Orphir Orkney Islands Council, 2022 | 1,543 | 20.74% | 6.74 |
| 3 | Truro Moresk & Trehaverne Cornwall, 2025 | 1,973 | 18.91% | 6.59 |
| 4 | Black Isle The Highland Council, 2022 | 4,709 | 24.87% | 6.46 |
| 5 | Stornoway North Comhairle nan Eilean Siar, 2022 | 1,354 | 23.26% | 6.14 |
| 6 | Lerwick South Shetland Islands Council, 2022 | 1,344 | 22.47% | 6.09 |
| 7 | Badenoch and Strathspey The Highland Council, 2022 | 5,529 | 23.15% | 5.79 |
| 8 | Milngavie East Dunbartonshire Council, 2022 | 6,249 | 25.06% | 5.53 |
| 9 | Isle of Bute Argyll & Bute Council, 2022 | 2,331 | 25.35% | 5.50 |
| 10 | Oban North and Lorn Argyll & Bute Council, 2022 | 4,097 | 30.61% | 5.49 |
For Scotland, “valid votes” means valid first preferences and “largest choice” means the largest party total or individual Independent total. For England and Wales, the table uses votes in elections with one vacancy. Rank measures the spread of these choices. It does not rank seat margins or ideological distance.
Scotland needs a different reading
Scottish council elections use the single transferable vote, or STV. Voters rank candidates. First preferences show the starting distribution of support. Later transfers and the election quota determine who wins the seats. The Electoral Commission explains the count.
We combine the first preferences of candidates from the same party. We keep Independents separate. The Kirkwall West and Orphir declaration shows why this matters. Seven Independent candidates stood alongside a Green candidate. Pooling all seven Independents would hide the separate choices voters made.
Black Isle also had a broad spread. It had 4,709 valid first preferences. The SNP received 1,171, Liberal Democrats 739, and Conservatives 695. Independent Sarah Atkin had 634 and the Greens had 624. Independent Okain John McLennan received 317, Independent Bev Smith 286, and Labour 243. The Highland Council reports give the ward's full count.
In Milngavie, all six choices received more than 10% of valid first preferences. The SNP had 1,566, Conservatives 1,293, Liberal Democrats 1,031, Labour 869, Independent Julie Duncan 830, and Greens 660. The figures appear in East Dunbartonshire's 2022 results.
There were also small first-preference leads. In Hazlehead, Queens Cross and Countesswells, the Liberal Democrats had 1,967 first preferences and the Conservatives 1,962, a five-vote gap among 7,736 valid votes. In Kirkcaldy North, Labour's 2,017 first preferences were four above the SNP's 2,013. These are party leads at the start of the count. They are not five-vote or four-vote winning margins.
What the sample covers
Scroll the table to see all columns.
| Year | Analysed contests | Gap below 1 percentage point | Gap of 10 votes or fewer | Winner below 30% |
|---|---|---|---|---|
| 2022 | 2,228 | 58 | 40 | 6 |
| 2023 | 2,483 | 44 | 42 | 9 |
| 2024 | 1,421 | 39 | 17 | 4 |
| 2025 | 360 | 24 | 19 | 14 |
The England and Wales sample contains 6,133 English contests and 359 Welsh contests. Scotland adds 347 contested wards from the 2022 main election. The Scottish workbook lists 355 wards. Eight records have no contested vote totals and are excluded.
The annual rows cover different councils, boundaries and election cycles. The 2025 sample, for example, excludes county divisions with E58 codes. Its 360 entries mainly cover unitary council areas. The differences between rows should not be presented as a national trend.
How we calculated the results
Close contests. We select England and Wales ward or unitary-division records with one vacancy, at least two candidates, recorded votes, and one elected candidate. The published gap is the elected candidate's recorded total minus the runner-up's recorded total. We divide this difference by the sum of the published candidate totals and multiply by 100. Rejected ballots are excluded. Deemed votes can remain in published totals after a tie. The table and counts retain that source convention, so they do not establish how many polls had exactly one extra ballot for the winner.
Vote spread. We add the published votes for each electoral choice, square each choice's total, and add those squares. We divide the square of the combined choice total by that sum. This gives the effective number of choices. Scottish candidates from the same national party are combined. Independents and candidates with no party description remain separate. In one-vacancy contests, each valid ballot vote goes to one candidate. A deemed vote after a tie is a separate counting rule.
Multiple vacancies. We exclude English and Welsh contests with more than one vacancy. Voters in those contests can vote for more than one candidate. A sum of candidate votes can therefore exceed the number of voters. It would give a misleading comparison with one-vacancy votes or Scottish first preferences. The Welsh Government's account of the rules sets out the vote-per-vacancy system.
Geography and dates. We use the areas and names recorded for each election. Some unitary authorities call their areas electoral divisions. We retain them and identify them as divisions where relevant. We exclude E58 county electoral divisions. Records from the 2023 workbook that lack an ONS ward code keep a separate Elections Centre record identifier. A current map should be checked against the boundary used at the election.
Data checks. Candidate votes, vacancy counts and elected flags were compared with fresh Commons Library workbooks. The Scottish first preferences reconcile to the reported valid-vote total in all 347 included wards. Two England and Wales records, Llanelwedd in 2022 and Cramlington Village in 2025, have no elected candidate flag in the source and are excluded. The downloadable audit records these checks. The exclusions reflect the workbook flags, rather than a claim that the seats remained vacant.
Limits. The study covers selected main-election cohorts from 2022 to 2025. It excludes 2026 results, intervening by-elections, uncontested elections, multi-vacancy England and Wales contests, and county divisions with E58 codes. The combined table also compares votes cast under different electoral systems. It is a useful comparison of recorded choices, rather than a complete league table of Britain's communities.
What these results can tell a reporter
For a local story, the first question is whether the split recurs. A one-vote result in one election can reflect a candidate, a local issue, or a change in turnout. Compare an earlier result only after checking that the boundary stayed the same.
The second question is how much of the electorate took part. Vote shares describe the people who cast valid votes. They do not include non-voters, and they do not describe every resident. A winning share below 20% is a precise result. It is not a measure of the winner's support among all residents.
The third question is what the voters were choosing between. A five-party contest and an eight-candidate Independent contest can both have a wide vote spread, with very different local causes. The result alone cannot establish those causes. It can identify a place where further reporting is likely to be useful.
There is no single official measure of a “politically divided ward”. The title here refers to close or widely spread electoral choices. The data does not measure anger, social conflict, or the ideological distance between candidates. Astley Bridge, Pontyclun East and Truro supply strong stories because their counts make the local competition visible. The next step is to ask the people who live there what produced it.
Download the data
- All 6,839 analysed contest and ward records as CSV, with dates, vote totals, scores and source links.
- Candidate vote totals as CSV, including Scottish first preferences.
- Method, coverage totals and data checks as JSON.
- Word copy of the article.
The CSV files use unrounded calculation values. Their vote_total field uses published candidate totals in England and Wales, including any deemed extra vote. In Scotland, it uses valid first preferences. Scottish winning-margin fields are blank because first-preference party leads are a different measure. A blank is not a zero. Source publication terms apply to the election data. The three charts are original ElectionMaps graphics.
Sources
- House of Commons Library and The Elections Centre: 2022 handbook and dataset, 2023 handbook and dataset, 2024 handbook and dataset, and 2025 handbook and dataset. Candidate results, area results and party-name tables. Fresh source files checked on 4 October 2026.
- Electoral Management Board for Scotland: 2022 local government election results workbook, RawDetails sheet. Candidate first preferences and ward valid-vote totals. Retrieved 4 October 2026.
- Returning Officer result notices and council result pages linked with the relevant case studies above. The article uses declared votes, with its own calculations of shares and vote gaps.
- Electoral Commission counting guidance and Welsh Government electoral law guidance for the difference between electoral systems.